STaR Chart Summary: Evaluating Technology Readiness at Mercedes High School
The STaR Chart is a critical tool for assessing where school districts stand concerning the Texas Long-Range Plan for Technology. At Mercedes High School, the chart evaluates key areas such as Teaching and Learning, Educator Preparation, Leadership, and Technology Infrastructure. With three-year comparison data, it highlights patterns in classroom technology use, professional development, leadership vision, and connectivity. The report underscores the need for enhanced assessments, increased technology integration, and continued educator training to foster a tech-savvy learning environment.

STaR Chart Summary: Evaluating Technology Readiness at Mercedes High School
E N D
Presentation Transcript
STaR Chart Summary Mercedes High School
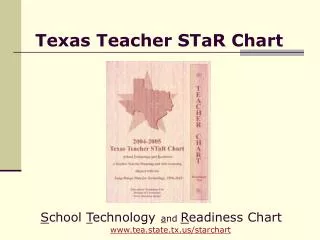
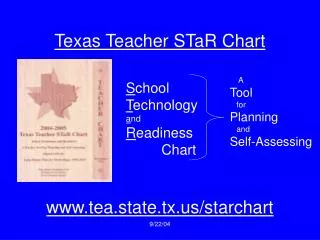
What is a STaR Chart? STaR-School Technology and Readiness Survey that determines where a school district stands in meeting the goals of the Texas Long-Range Plan for Technology It also informs a district know how they are doing in reaching their own goals
STaR Chart Key Areas Teaching and Learning (TL) Educator Preparation and Development (EP) Leadership, Administration and Instructional Support (L) Infrastructure for Technology (INF)
Key Area I: Teaching and Learning Focus Areas 3 Year Comparison Data TL1 - Patterns of Classroom Use TL2 - Frequency/Design of Instructional Setting TL3 - Content Area Connections TL4 - Technology Applications TEKS Implementation TL5 - Student Mastery of Technology Applications TL6 - Learning
Key Area 2: Educator Preparation and Development Focus Area 3 Year Comparison Data EP1 - Professional Development Experiences EP2 - Models of Professional Development EP3 - Capabilities of Educators EP4 - Access to Professional Development EP5 - Levels of Understanding and Patterns of Use EP6- Professional Development for Online Learning
Key Area III: Leadership Focus Area 3 Year Comparison Data L1 - Leadership and Vision L2 - Planning L3 - Instructional Support L4- Communication and Collaboration L5 - Budget L6 - Leadership and Support for Online Learning
Key Area IV: Infrastructure for Technology Focus Area 3 Year Comparison Data INF1- Students per Computers INF2- Internet Access Connectivity Speed INF3- Other Classroom Technology INF4- Technical Support INF5- Local Area Network Wide Area Network INF6- Distance Learning Capacity
Variances Most occurred from the years 2006-2007 to 2007-2008 Most were in Key Area 1: Teaching and Learning All Key Areas remain in the Developing Technology Stage
Recommendations Develop a Needs Assessment Bring in More Technology Provide Trainings on New Technologies Encourage Integrating Technology NO MORE Today’s Technology
Future Growth in Integration of Technology Development in Communication between teachers, students, and administration Educator Encouragement and Self-discipline with New Technologies