Download
1 / 50
500 likes | 516 Views
This study investigates the influence of Phoenix on mesoscale meteorological processes, including wind, temperature, and moisture fields. It explores the applications of these simulations in weather forecasting, air quality simulations, urban heat island studies, and human comfort research.

E N D
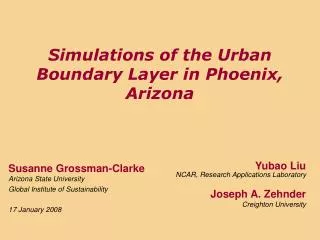
Simulations of the Urban Boundary Layer in Phoenix, Arizona Susanne Grossman-ClarkeArizona State University Global Institute of Sustainability 17 January 2008 Yubao LiuNCAR, Research Applications Laboratory Joseph A. Zehnder Creighton University
Introduction • Extent of Phoenix ~ 4000 km2 & population 3.7 Million: Potentially large enough to influence mesoscale meteorological processes. • Investigation of Phoenix’ influence on weather (NSF ATM-0710631 and NSF DEB-0423704 CAP LTER): • Wind, temperature and moisture fields. • Mesoscale circulations generated by urban–rural thermal differences. • Orographic circulations. • Convective activity. • Applications • Weather forecasting, air quality simulations, urban heat island, human comfort and heat related illness studies.
Introduction Physical characteristics of cities affect momentum, turbulent heat transport & surface energy balance. • Urban roughness. • Increased heat storage and heat conductivity in built materials. • Anthropogenic heating (electricity consumption and traffic). • Long-wave radiation trapping due to urban form. • Urban vegetation.
Introduction Urban Canopy Models (UCM) Describe area average effect of cities on drag, turbulence production, heating, and surface energy balance. State variables within the urban canopy are of interest. Differences in physical approach and detail. Roughness and drag approach. Application of UCM depends on PBL scheme.
Introduction • MM5 modifications (bulk roughness scheme) • Urban land use. • Surface energy balance. • Turbulent transport. • Medium Range Forecast PBL scheme. • Testing of original and modified MM5 • Surface and upper air data from two extended field campaigns in Phoenix. Grossman-Clarke et al. 2005, JAM Grossman-Clarke et al. 2007, JAMC
Urban Land Use derived from ASTER Satellite Data Stefanov et al. 2001, Remote Sens. Environ.
MM5 Model Description • Based on Landsat Thematic Mapper satellite images (visible, shortwave infrared & vegetation index). • Post-classification in expert system using additional data sets. • Derive land cover data with 30 m resolution. Stefanov et al. 2001, Remote Sens. Environ.
MM5 Model Description • Convert data for use in MM5 or WRF. • Re-projecting data to the geographic projection parameters of 30-second USGS data set. • Mapping categories to 24 USGS categories. • Land cover class with highest fraction of cover assigned to 30sec grid cell.
MM5 Model Description • Additional urban land use/cover classes: • urban built-up (no vegetation) • mesic residential (well-watered) • xeric residential (drought-adapted vegetation)
MM5 Model Description 24-category USGS classification and two additional urban classes.
MM5 Model Description Standard land use Improved
MM5 Model Description Surface Energy Balance Equation Tg … Ground temperature (K) cg … Heat capacity of the ground (J m-2 K-1) Rn … Net radiation balance (W m-2) H … Sensible heat flux (W m-2) G … Soil heat flux (W m-2) lE … Latent heat flux (W m-2)
MM5 Model Description Latent Heat Flux M … Moisture availability factor [-] z0 … Roughness length [m] Yh … Stability function [-] qvs … Saturation specific humidity [-] qva … Specific humidity at za[-]
MM5 Model Description • Heat storage in man-made materials; modified heat capacity and thermal conductivity (Liu et al. 2004). • Sky view factor in the in the long wave radiation balance (Noilhan 1981): w – Road width h – Building height
MM5 Model Description • Anthropogenic heating Qa from traffic and electricity consumption (Sailor & Lu 2004). Qa,vQa,e Anthropogenic heat from traffic and electricity rpop Avg. population density for urban LU classes h Hour of day FtFe Fractional traffic profiles and electricity consumption DVDc Avg. daily vehicle distance traveled per person in Phoenix EV Energy release per vehicle per meter of travel Ec Daily per capita electricity consumption
MM5 Model Description Anthropogenic Heat □ Urban built-up Xeric residential x Mesic residential
MM5 Model Description Temperature tendency equation at first prognostic level: QHeating rate resulting from diabatic processes Dt Horizontal and vertical diffusion () Adiabatic warming
MRF Scheme Nonlocal-K Approach for Turbulent Diffusion within the Mixed Layer Turbulence diffusion equation for potential temperature within the mixed-layer: Correction to local gradient to represent large eddy turbulence: … Potential temperature (K) w … Vertical velocity (ms-1) K … Eddy diffusivity (m2s-1) b … Empirical parameter (-) Hong and Pan 1996, Monthly Weather Review Troen and Mahrt 1986, Boundary Layer Met.
MRF SchemeMixed Layer Turbulent Diffusivity Coefficients Kzm for Momentum with k ... von Karman constant (-) ws ... Mixed layer velocity scale (ms-1) z ... Height (m) h ... PBL height (m) p ... Profile shape exponent (p=2) u* ... Friction velocity (ms-1) Fm ... Wind profile function at top of surface layer (-) Cm ... Drag coefficient for momentum (-) Uc ... Horizontal wind speed under convective conditions(ms-1)
MRF SchemePBL Height for Mixed Layer Ribcr … Critical bulk Richardson number (0.5) Qva … Virtual potential temperature at first prognostic level Qv … Virtual potential temperature at z=h Qg … Virtual potential temperature at ground level z=0 U(h) … Wind speed at z=h
MRF Scheme Under convective conditions w* is added to U in surface flux calculations to consider extra eddy mixing induced by surface-layer instability: with Ch ... Drag coefficient for heat (-) g ... Potential temperature at ground (K) a ... Potential temperature at first prognostic level (K) Uc ... Wind speed under convective conditions (ms-1) U ... Mean horizontal wind speed (ms-1) w* ... Convective velocity (ms-1) C,b... Empirical constants vg ... Virtual potential temperature at ground (K) va ... Virtual potential temperature at first prognostic level (K)
MRF Scheme Under free-convection conditions, tendency to: • Underestimate near-surface wind speed. • Overestimate sensible heat fluxes. • Overestimate PBL heights. • Because: • w* function of height of the lowest prognostic level. • Virtual surface temperature depends on the choice of surface model. • High values of w* result in overestimation u* weak surface winds, high surface sensible heat fluxes, high PBL heights. Zhang and Zheng 2004, JAM Liu et al. 2006, JAM
MRF SchemeBeljaars’ Approach for Convective Velocity • w* directly linked to surface heat flux and PBL height. Both related to strength of convective turbulence. • No tuning parameter. • Parameter b in Uccalibrated with LES (0.8 – 1.3). Beljaars 1995, Quart. J. Roy. Meteor. Soc. Liu et al. 2006, JAM
Comparison of Model Behavior with Field Observations • Meteorological and atmospheric chemistry field study in Phoenix 10 May to 10 June of 1998 (Fast et al. 2000): • To study the convective boundary layer. • 915-MHz radar wind profiler near Sky Harbor Airport to give hourly values of wind speed and wind direction. • Radiosondes near Sky Harbor Airport on 14 days at 0800, 1000, 1200, 1400, 1700 LST. • “Phoenix Sunrise Experiment” 10 – 30 June 2001 (Doran et al. 2003): • To study the evolving structure of the PBL during the morning transition. • 915-MHz radar wind profiler near Sky Harbor Airport. • Radiosondes near Sky Harbor Airport site on 12 days at 0000, 0200, 0500, 0800, 0900 and 1000 LST.
Design of Numerical Simulations • Fifth Generation PSU/NCAR Mesoscale Model (MM5). • Initial and Boundary Conditions from NCEP/ETA grid 212 (40 km grid spacing). • 10 May – 10 June 1998 & 10 – 30 June 2001. • Nested Run of MM5: 54 km 18 km 6 km 2 km. • 51 vertical layers. • Original and modified MRF PBL scheme (Liu et al. 2006) and 5 layer soil model. • Urban surface energy balance (Grossman-Clarke et al. 2005).
Comparison of MM5 Simulations with Field Observations • Original MM5. • Original MRF scheme and surface modifications. • Modified MRF scheme and surface modifications.
Comparison of MM5 Simulations with Field Observations 8 June 1998 at Sky Harbor Airport Heat storage, anthropogenic heat, sky view factor improves nighttime temperatures. Correcting land use improves daytime temperatures.
Results - Surface Temperature and Winds • 10 May to 10 June 1998 simulation period for NWS station at Sky Harbor Airport.
Results - Surface Temperature and Winds • 10 June to 30 June 2001 simulation period for NWS station at Sky Harbor Airport.
Conclusions • Bulk approaches for the urban surface energy balance enabled MM5 to consistently improve performance for near-surface meteorological variables. • Modified MRF PBL scheme by Liu et al. (2006) led to improved: • Profiles of potential temperature. • PBL height determination • Wind speed in the lower PBL • MM5 can be applied in studies investigating the influence of urbanization on weather with higher confidence.
Work with WRF • Ported model physics into WRF; results are applicable to WRF YSU scheme; UCM and LSM vegetation parameterization for Phoenix based on gas exchange measurements. • Investigate the combined influence of global climate change and urbanization on near-surface air temperatures on human comfort and health (NSF Coupled Human Natural Systems Proposal). • Investigate the influence of urbanization on weather in Phoenix (NSF ATM-0710631) – Co-PIs C.S.B. Grimmond, King’s College London & J.A. Zehnder, Creighton University in collaboration with F. Chen, National Center for Atmospheric Research
WRF Urban Canopy Model • Consideration of more detailed characteristics of the urban surface (construction materials and urban form) and urban vegetation processes possible. za First prognostic level. Ta, TS Air temperature at first prognostic level and street canyon. TR, TW, TG Surface temperatures of roof, wall, ground. H, HR, HW, HG, Ha Sensible heat fluxes.
Part I -Evaluate the UCM simulated surface energy fluxes with: • Comprehensive meteorological and energy flux data obtained from previous urban field experiments. • Surface energy balance measurements in at least two typical Phoenix neighborhoods during a one year period beginning in summer 2008. Part II -Apply the WRF/UCM system to the Phoenix metro area to investigate: • How past and potential future land use changes influence near surface atmospheric state variables and characteristics of the planetary boundary layer? • How mesoscale circulations due to the variability in urban and rural land use interact with the mesoscale thermal circulations due to complex terrain? • If the increasing extent of the urban area affects the development and propagation of summer thunderstorms.
Potential Effects of Phoenix on Monsoon Convective Activity • Increased surface roughness suppresses thunderstorm outflow and inhibits propagation into the region. • Urban heat island effect. • Surface roughness causes divergence of air flow around the urban area and convergence zone downwind. • Evapotranspiration from irrigated vegetation and anthropogenic open water surfaces increases CAPE. • Interaction of topograhically and physiographically forced circulations. • Pollution aerosols.
Influence of Urbanization on Near-surface Air Temperature • Model performance during extreme heat events for past and projected future land use/cover in the Phoenix metropolitan area. • 12 - 17 July 2003 and 9 - 12 August 2003. • Simulations of surface temperature and relative humidity.
WRF – Simulations for Heat Waves 12-17 July 2003 & 9-12 August 2003