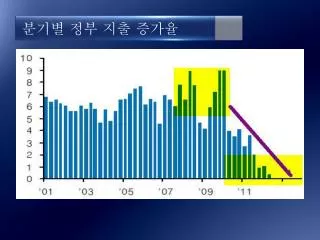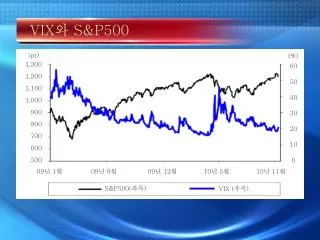
VIX 와 S&P500
70 likes | 221 Views
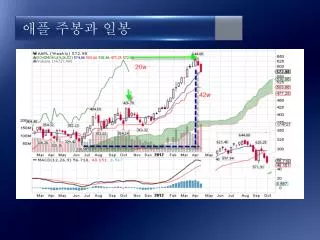
VIX 와 S&P500. (pt). (%). 60 50 40 30 20 10 0. 1,300 1,200 1,100 1,000 900 800 700 600 500. 09 ë…„ 1 ì›” 09 ë…„ 6 ì›” 09 ë…„ 12 ì›” 10 ë…„ 5 ì›” 10 ë…„ 11 ì›”. S&P500( 좌측 ). VIX ( 우측 ). CHIX 와 중êµì¦ì‹œ. (pt). (%). 25,000 20,000 15,000

VIX 와 S&P500
E N D
Presentation Transcript
VIX와 S&P500 (pt) (%) 60 50 40 30 20 10 0 1,300 1,200 1,100 1,000 900 800 700 600 500 09년 1월 09년 6월 09년 12월 10년 5월 10년 11월 S&P500(좌측) VIX (우측)
CHIX와중국증시 (pt) (%) 25,000 20,000 15,000 10,000 5,000 0 80 70 60 50 40 30 20 10 0 09년 1월 09년 6월 09년 12월 10년 5월 10년 11월 FTSE/Xinhua25 (우측) CHIX(좌측)
CHIX와중국증시 (pt) (%) 25,000 20,000 15,000 10,000 5,000 0 80 70 60 50 40 30 20 10 0 09년 1월 09년 6월 09년 12월 10년 5월 10년 11월 FTSE/Xinhua25 (우측) CHIX(좌측)
CHIX와중국증시 (pt) (%) 25,000 20,000 15,000 10,000 5,000 0 80 70 60 50 40 30 20 10 0 09년 1월 09년 6월 09년 12월 10년 5월 10년 11월 FTSE/Xinhua25 (우측) CHIX(좌측)
CHIX와중국증시 (pt) (%) 25,000 20,000 15,000 10,000 5,000 0 80 70 60 50 40 30 20 10 0 09년 1월 09년 6월 09년 12월 10년 5월 10년 11월 FTSE/Xinhua25 (우측) CHIX(좌측)