Chi Square Tests
Chi Square Tests. Chapter 17. Nonparametric Statistics. A special class of hypothesis tests Used when assumptions for parametric tests are not met Review: What are the assumptions for parametric tests?. Assumptions for Parametric Tests.


Chi Square Tests
E N D
Presentation Transcript
Chi Square Tests Chapter 17
Nonparametric Statistics • A special class of hypothesis tests • Used when assumptions for parametric tests are not met • Review: What are the assumptions for parametric tests?
Assumptions for Parametric Tests • Dependent variable is a scale variable interval or ratio • If the dependent variable is ordinal or nominal, it is a non-parametric test • Participants are randomly selected • If there is no randomization, it is a non-parametric test • The underlying population distribution is normal • If the shape is not normal, it is a non-parametric test
When to Use Nonparametric Tests • When the dependent variable is nominal • What are ordinal, nominal, interval, and ratio scales of measurement? • Used when either the dependent or independent variable is ordinal • Used when the sample size is small • Used when underlying population is not normal
Limitations of Nonparametric Tests • Cannot easily use confidence intervals or effect sizes • Have less statistical power than parametric tests • Nominal and ordinal data provide less information • More likely to commit type II error • Review: What is type I error? Type II error?
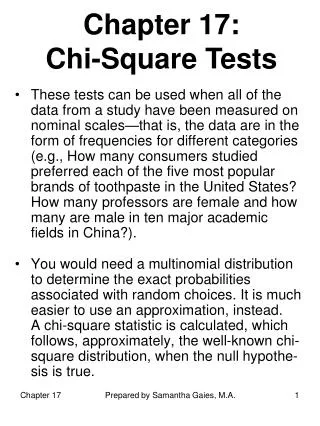
Chi-Square Test for Goodness-of-Fit • Nonparametric test when we have one nominal variable • These variables, also called "attribute variables" or "categorical variables," classify observations into a small number of categories. A good rule of thumb is that an individual observation of a nominal variable is usually a word, not a number • Examples of nominal variables include sex (the possible values are male or female), genotype (values are AA, Aa, or aa), or ankle condition (values are normal, sprained, torn ligament, or broken)
Chi-Square Test for Goodness-of-Fit • Nonparametric test when we have one nominal variable • Measurement v. Nominal: Imagine recording each observation in a lab notebook. If you record a number (width, height, speed, errors) it’s a measurement, if you record a label it’s nominal (sex, popularity, beauty)
Examples of When to Use Chi-Square • The observed counts of numbers of observations in each category are compared with the expected counts, which are calculated using some kind of theoretical expectation, such as a 1:1 sex ratio, or 4:2:1 population density in following example. • Example: looking at an area of shore that had 59% of the area covered in sand, 28% mud and 13% rocks (4:2:1); if seagulls were standing in random places, your null hypothesis would be that 59% of the seagulls were standing on sand, 28% on mud and 13% on rocks (4:2:1).
Examples of Chi-Square • Does the count of the Observed match the count of the Expected? • Mendel crossed peas that were heterozygotes for Smooth/wrinkled, where Smooth is dominant. The expected ratio in the offspring is 3 Smooth: 1 wrinkled. He observed 423 Smooth and 133 wrinkled. • The expected frequency of Smooth is calculated by multiplying the sample size (556) by the expected proportion (0.75) to yield 417. The same is done for green to yield 139. The number of degrees of freedom when an extrinsic hypothesis is used is the number of values of the nominal variable minus one. In this case, there are two values (Smooth and wrinkled), so there is one degree of freedom. • The result is chi-square=0.35, 1 d.f., P=0.557, indicating that the null hypothesis cannot be rejected; there is no significant difference between the observed and expected frequencies.
Examples of Chi-Square • Does the count of the Observed match the count of the Expected? • Mannan and Meslow (1984) studied bird foraging behavior in a forest in Oregon. In a managed forest, 54% of the canopy volume was Douglas fir, 40% was ponderosa pine, 5% was grand fir, and 1% was western larch. They made 156 observations of foraging by red-breasted nuthatches; 70 observations (45% of the total) in Douglas fir, 79 (51%) in ponderosa pine, 3 (2%) in grand fir, and 4 (3%) in western larch. The biological null hypothesis is that the birds forage randomly, without regard to what species of tree they're in; the statistical null hypothesis is that the proportions of foraging events are equal to the proportions of canopy volume. The difference in proportions is significant (chi-square=13.593, 3 d.f., P=0.0035).
How the test works • The test statistic is calculated by taking an observed number (O), subtracting the expected number (E), then squaring this difference. The larger the deviation from the null hypothesis, the larger the difference between observed and expected is. • Squaring the differences makes them all positive. Each difference is divided by the expected number, and these standardized ratios are summed: the more differences between what you would expect and what you get the bigger the number.
Chi-Square Test for Goodness-of-Fit • The six steps of hypothesis testing Question: Are the best soccer players born early rather than later in the year ? 1. Identify 2. State the hypotheses 3. Characteristics of the comparison distribution 4. Critical values 5. Calculate 6. Decide
Chi-Square Test for Goodness-of-Fit • The six steps of hypothesis testing • Identify Pop. Distribution & Assumptions • Two populations, one distribution that matches expected outcomes and another where distribution matches observed outcomes. E.g., great soccer players are born evenly throughout year, great soccer players born in first half of year. • Comparison distribution is chi-square • First assumption, variable of interest is nominal, birth month. Second, independence of observation, that is each observation fits in only one category, no soccer player has two birth months. Third, random selection of pop ( in this case, they are only Germans, and only elite). Fourth, large enough sample size, ideally 5 times the number of cells (in this case N= 56 > 10 (2 x 5).
Chi-Square Test for Goodness-of-Fit • State the hypotheses: does the Observed count of elite soccer player Birth Months match the Expected count of elite soccer player Birth Months • Null: Match • Alternative: No match
Chi-Square Test for Goodness-of-Fit • Characteristics of the comparison distribution • Only two categories of soccer players
Chi-Square Test for Goodness-of-Fit • Critical values
Chi-Square Test for Goodness-of-Fit • Calculate
Chi-Square Test for Goodness-of-Fit • Calculate
A more typical Chi-Square • Evenly divided expected frequencies • Can you think of examples where you would expect evenly divided expected frequencies in the population?
Chi-square test for independence • Analyzes 2 nominal variables • The six steps of hypothesis testing 1. Identify 2. State the hypotheses 3. Characteristics of the comparison distribution 4. Critical values 5. Calculate 6. Decide
Cramer’s V (phi) • The effect size for chi-square test for independence
Relative Risk • We can quantify the size of an effect with chi square through relative risk, also called relative likelihood. • By making a ratio of two conditional proportions, we can say, for example, that one group is three times as likely to show some outcome or, conversely, that the other group is one-third as likely to show that outcome.
Adjusted Standardized Residuals • The difference between the observed frequency and the expected frequency for a cell in a chi-square research design, divided by the standard error; also called adjusted residual.