Download
1 / 21
210 likes | 304 Views
Explore a detailed model setup and ongoing developments of an Arctic ice-ocean model, with comparisons to historical data and future improvements. Utilizes ROMS for ocean model, EOS-80 for sea ice, and integrates various observational datasets for validation.

E N D
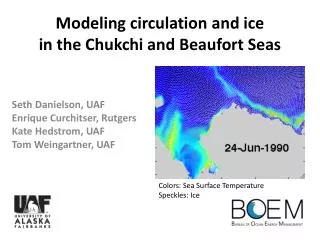
Modeling circulation and ice in the Chukchi and Beaufort Seas Seth Danielson, UAF Enrique Curchitser, Rutgers Kate Hedstrom, UAF Tom Weingartner, UAF Colors: Sea Surface Temperature Speckles: Ice
Outline • Description of model • Some model-data comparisons • Ongoing development & future improvements
Model setup Seafloor Topography • Pan-arctic domain • 50 vertical levels • 20-year hindcast (1985-2004) • Telescoping grid 3.5-7 km resolution in Chukchi-Beaufort Seas
Model setup Grid size (km) • Pan-arctic domain • 50 vertical levels • 20-year hindcast (1985-2004) • Telescoping grid 3.5-7 km resolution in Chukchi-Beaufort Seas
Arctic ice-ocean model • Built on the Regional Ocean Modeling System (ROMS) • Oceanic boundary and initial conditions from the Simple Ocean Data Assimilation (SODA) reanalysis • Surface forcing from Common Ocean Reference Experiment (CORE-2) • Air-sea fluxes computed via bulk formulae • Monthly and inter-annually varying river discharge from Dai and Trenberth (2002) • Dynamic-thermodynamic sea ice model following Budgell (2005)
Sea ice component • Dynamic-thermodynamic sea ice model implementation of Budgell (2005) • Elastic-Viscous-Plastic (EVP) following Hunke and Dukowicz (1997) and Hunke (2001) • Thermodynamics following Mellor and Kantha (1989) and Hakkinen and Mellor (1992) • Frazil ice production following Steele et al., (1989) • Imposition of landfast ice extent in the Beaufort Sea following monthly climatology of Mahoney et al. (2006; http://mms.gina.alaska.edu/)
Model-data comparisons No data assimilation: we can use a wide variety of historical data to independently assess performance. • SSM/I passive microwave ice concentration • ICESat sea ice thickness • Moored temperature, salinity, velocity • CTD hydrography • Satellite-tracked drifters
Sea ice concentration observed:modeled cross-correlation 1.0 0.8 0.6 0.4 0.2 -0.2 -0.4 -0.6 -0.8 -1.0
Sea ice concentration Averaged over Chukchi-Beaufort region Modeled Observed
Timing of ice setup in fall RMSD = 15.5 days RMSD = 6.5 days
Mid-winter ice thickness Model ice thickness (m) Model – ICESat Observed (m) • Model ice too thin in NE Chukchi • Model Ice too thick along Siberian coast
Northeast Chukchi near Barrow Canyon (site MK1, 71.1°N, 159.5°W)
Nearshore Beaufort Sea (McClure site, 70.3°N, 147.5°W) Landfast Ice Landfast Ice Open water
Northeast Chukchi near Barrow Canyon (site MK1, 71.1°N, 159.5°W)
Next Steps: model improvements underway • Surface forcing fromModern-Era Retrospective Analysis for Research and Applications (MERRA) • Northeast Pacific (NEP6) regional hindcast used for oceanic boundary conditions in Bering Strait • Improved bathymetric Digital Elevation Models Observed Run #5 Run #7 (NEP6)
Alaska Region Digital Elevation Model (ARDEM) Help improve your region of interest! ARDEM update coming in 2012-2013throughfunding from the North Pacific Research Board. All bathymetric sounding data welcome. sldanielson@alaska.edu http://mather.sfos.uaf.edu/~seth/bathy/
Next steps: toward ice/ocean model improvements and operational applications • Algorithm development and testing: • Growth and breakup of landfast ice • Melt pond dynamics… ice algae? • Wind-ice-ocean-oil interactions • Merge ice/ocean components… ice shelf approach? • Surface heat flux algorithms for ice-infested waters • Model validation through community-based ocean monitoring. • Real-time nowcast/forecast ice-ocean models could inform industry, regulators, scientific research programs and emergency response efforts. Success in many future model advances depends on field observations
Summary • Model strengths include: • Capturing seasonal changes in nearshore Beaufort Sea • Wind-driven flows • Reproduction of sea ice concentration anomalies • Model weaknesses include: • Mid-winter ice thickness: too thin in the northeast Chukchi, too thick along the Siberian Coast • Insufficient summer ice melt or too much winter ice growth • The data-model comparisons continue to guide model development efforts by identifying features and sub-grid scale processes that require better parameterizations.