Download
1 / 26
260 likes | 410 Views
MODELING OF WIND WAVES AND SURGE EVENTS IN THE CASPIAN, BLACK, AZOV AND BALTIC SEAS. WORKING GROUP 1. TASKS OF WORKING GROUP 1. INITIAL DATA. BATHYMETRY. INITIAL DATA. WIND FORCING NCEP/NCAR Reanalysis.

E N D
MODELING OF WIND WAVES ANDSURGE EVENTS IN THE CASPIAN, BLACK, AZOV AND BALTIC SEAS WORKING GROUP 1
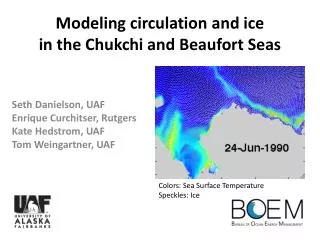
INITIAL DATA BATHYMETRY
INITIAL DATA WIND FORCING NCEP/NCAR Reanalysis
ADVANCED CIRCULATION MODEL FOR OCEANIC, COASTAL AND ESTUARINE WATERS (ADCIRC) is a system of computer programs for solving time dependent, free surface circulation and transport problems in two and three dimensions. • Typical ADCIRC applications include modeling tides and wind driven circulation, analysis of hurricane storm surge and flooding, dredging feasibility and material disposal studies, larval transport studies, near shore marine operations. ADCIRC is a highly developed computer program for solving the equations of motion for a moving fluid on a rotating earth. • ADCIRC can be forced with: • - elevation boundary conditions; • - normal flow boundary conditions; • - surface stress boundary conditions; • - tidal potential; • earth load/self attraction tide.
3D visualization optimized for performance SMS is the most advanced software system available for performing surface-water simulations in a three-dimensional environment. Interact with models in true 3D Optimized OpenGL graphics for improved hardware rendering. Create photo-realistic renderings Generate animations for PowerPoint or web presentations Drape images over the model and control the opacity Annotations – Add north arrows, scale bars, reference images, company logos, and more Flexible modeling approaches Aquaveo pioneered the conceptual model approach. Work with large, complex models in a simple and efficient manner by using the conceptual modeling approach and easily update or change the model as needed. SMS also has powerful tools to build meshes and grids. Import what you need Models require data from many different sources. That’s why SMS is built to easily import numerous file types: Raster images including georeference and projection support; Topographical maps & aerial photos; Elevation & bathymetry data; Web data services such as TerraServer; ArcGIS geodatabases and shapefiles CAD files including .dwg, .dgn, and .dxf formats
Initial Distribution Method Generalized characteristic of the wave regime are regime distributions. Analysis of measurement data showed that one-dimensional distribution of wave heights and periods are described by a logarithmically normal distribution: where μ - mathematical expectation, σ - the standard of the wave height logarithms. This distribution can be expressed in another way: where s=1/σ. To calculate the characteristics of extreme wave was the initial distribution method (IDM, Initial Distribution Method), in which to evaluate the highest wave height is taken quintile h(p) of regime height distribution F (h) for a given probability p:
WIND WAVE The largest calculated parameters of wind waves
WIND WAVE Seasonal variability
CASPIAN SEA Average area, km2 Number of storms Average duration, h BALTIC SEA
WIND WAVE Long-term variability
CASPIAN SEA BLACK SEA BALTIC SEA
WIND WAVE Significant wave height of a possible 1 time in 100 years
BLACK SEA CASPIAN SEA BALTIC SEA AZOV SEA
NORTHERN CASPIAN Black line - the boundary of the computational domain; blue line – shoreline; red points – sea; blue points - land Grid -107651 cells and 54805 nodes Storm surge - 23-27 December 1968