Download
1 / 36
360 likes | 492 Views
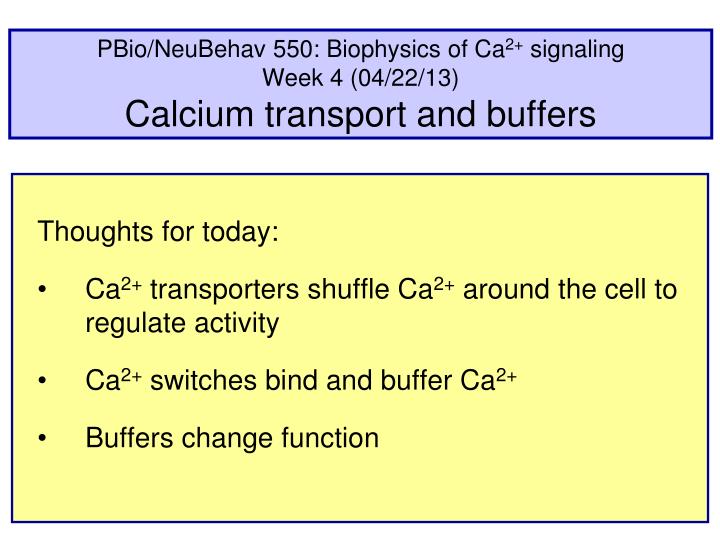
PBio/NeuBehav 550: Biophysics of Ca 2+ signaling Week 4 (04/22/13) Calcium transport and buffers. Thoughts for today: Ca 2+ transporters shuffle Ca 2+ around the cell to regulate activity Ca 2+ switches bind and buffer Ca 2+ Buffers change function. Ca 2+ fluxes in an excitable cell.

E N D
PBio/NeuBehav 550: Biophysics of Ca2+ signalingWeek 4 (04/22/13)Calcium transport and buffers Thoughts for today: Ca2+ transporters shuffle Ca2+ around the cell to regulate activity Ca2+ switches bind and buffer Ca2+ Buffers change function
Ca2+ fluxes in an excitable cell Typical Ca2+ fluxes in a pituitary cell Inputs: hormones, synaptic inputs, cytokines, growth factors PIP2 VG Ca channels Agonist DAG R PLC Na+-Ca2+ exchanger Gq IP3 Ca2+ Ca2+ Ca2+ IP3R channel SERCA pump Na+ ATP nucleus LDCSG Plasma membrane ER Ca2+ Ca2+ ATP PM Ca2+ ATPase Mito Ca2+ Na+ SOC/CRAC channel Responses: Exocytosis, channel gating, enzyme activities, cell division, proliferation, gene expression
Anterior pituitary control by portal peptide factors Hypothalamus Brain rostral Blood GnRH Posterior pituitary Anterior pituitary FSH/LH
GnRHOscill93 GnRH makes Ca2+ and IK(Ca) oscillate gonadotrope loaded by pipette with 50 M indo1 GnRH I K(Ca) 100 IK(Ca) (pA) 0 2 [Ca2+] [Ca2+]i (mM) 0 0 100 200 300 Time (s) (Tse & Hille, 1992)
GnRH induces oscillatory exocytosis synchronous with Ca2+ 40 nM GnRH pituitary gonadotroph 2 calcium Ca2+ (M) 0 Ca2+ 600 Cm (fF) membrane area 0 150 exocytosis rate dCm/dt fF/s 0 0 50 100 Time (s) (Tse & Hille, Science, 1992)
Ca2+ suffices. Other PLC products are not essential. gonadotrope with caged Ca in pipette UV flash release Cai from DM nitrophen 600 Before flash Cai = 100 nM After flash Cai = 50 M growing membrane area 400 Ca2+ Plasma membrane area change (Cm fF) 200 0 0 1 2 Time (s) (Tse, Tse, Hille, Horstmann, Almers, Neuron, 1997)
GonadoCaFree Ca2+ influx is not required hormone-activated gonadotrope with 50 M indo1 0.8 0 Ca2+ (EGTA) Ca2+ ER 0.4 [Ca2+]i (mM) 0 0 100 200 300 400 Time (s) (Tse & Hille, 1992)
Ca2+ oscillations need the SERCA pump pituitary gonadotrope 2 nM GnRH 1.5 Ca2+ ER 10 M BHQ 1 [Ca2+]i (mM) 0.5 0 0 200 400 Time (s) BHQ, a readily reversible blocker of SERCA pumps arrests Ca2+ oscillations at the cytoplasmic high-Ca2+ level. (Tse, Tse, Hille, PNAS, 1994)
Dye loading in intracellular stores of gonadotrope 0 s 30 s 60 s Epifluorescence) Brightfield Mag-Indo1 AM Mn2+ 60 s Mn2+ ER ER Mag-Indo1 is a Ca reporter with a low Ca affinity (~35 uM) Unloading & quenching Preloading (Tse, Tse, Hille, PNAS, 1994)
GnRH releases Ca2+ from stores ER Pituitary gonadotroph patch clamped and loaded with Mag-indo-1 in ER com-partments. (Tse, Tse, Hille, PNAS, 1994) 60 calcium depletes in stores stores Ca2+ (M) 2 nM GnRH 32 "cytoplasmic calcium" IK(Ca) 0 250 500 Time (s) Steady state stores calcium cytoplasmic calcium Ca2+ ? 0 25 50 Some Ca goes missing!! Time (s)
Ca2+ fluxes in an excitable cell Typical Ca2+ fluxes in a pituitary cell Inputs: hormones, synaptic inputs, cytokines, growth factors PIP2 VG Ca channels Agonist DAG R PLC Na+-Ca2+ exchanger Gq IP3 Ca2+ Ca2+ Ca2+ IP3R channel SERCA pump Na+ ATP nucleus LDCSG Plasma membrane ER Ca2+ ATP Ca2+ Mito PM Ca2+ ATPase SOC/CRAC channel Ca2+ Na+ Responses: Exocytosis, channel gating, enzyme activities, cell division, proliferation, gene expression
ChromCCCP Rate of fall is a measure of rate of Ca clearance from cytoplasm without mitochondrial uptake Mitochondrial Ca2+ clearance dominates in chromaffin cells chromaffin cell loaded with indo1 CCCP collapses proton motive force 2 CCCP Cytoplasmic [Ca2+]i (mM) 1 control 0 0 60 120 Time (s) A 1-s depolarization loads cell with calcium. Clearance then begins. (Herrington, Park, Babcock, Hille, 1996)
ChromCCCP2 Mitochondria store Ca2+ for a while; CCCP lets it out 3 chromaffin cell loaded with indo1 CCCP stops uptake into mitochondria 2 CCCP1 Cytoplasmic [Ca2+]i (mM) Can we "see" Ca2+ in mitochondria? 1 CCCP2 CCCP1 0 CCCP2 0 30 60 90 120 Time (s) A 1-s depolarization loads cell with calcium. Clearance then begins. (Herrington, Park, Babcock, Hille, 1996)
ChromDeconv96 Cationic rhod-2 accumulates in mitochondria chromaffin cell loaded with rhod-2 KCl wash 14 mm deconvolution microscopy (Babcock, Herrington, Goodwin, Park, Hille, 1997)
ChromRhod2 Mitochondria pump Ca2+ back to cytoplasm chromaffin cell loaded with rhod-2-AM and calcium green in pipette 1.0 0.6 Ca2+ Mito 0.4 mito. (rhod-2) [Ca2+]mito (mM) [Ca2+]cytopl (mM) 0.5 cyto. (CG) 0.2 0 0 100 200 300 Time (s) (Babcock, Herrington, Goodwin, Park, Hille, 1997)
ChromRhod2A Rhod-2 is reporting mitochondrial Ca2+ chromaffin cell loaded with rhod-2 AM and calcium green rhod2 mitochondria 0.5 [Ca2+]mito (mM) CCCP 0.1 1.0 calcium green cytoplasm 0.5 [Ca2+]cyto (mM) 200 s 0 oligomycin (Babcock, Herrington, Goodwin, Park, Hille, 1997)
ChromRates Ca2+ transporter rates in chromaffin cells 60 These rates are calculated from slopes of [Ca] decay after a Ca load, multiplied by the cytoplasmic Ca binding ratio, to yield the actual moles crossing cell membranes. mitochondria 40 Transport rate (bound + free) (mM/s) 20 rest pmCa-ATPase NCX 0 0 0.5 1.0 1.5 free [Ca2+]c (mM) (Herrington, Park, Babcock, Hille, 1996)
3 clearance Ca2+ clearance rates for three cell types pancreatic beta cell spermatozoon chromaffin cell 80 total 60 60 mito SERCA 40 40 2 Transport rate (mM/s) total PMCA NCX 1 20 20 NCX PMCA PMCA mito NCX 0 0 0 0 1.0 0 1 2 0 1.0 [Ca2+]c (mM) [Ca2+]c (mM) [Ca2+]c (mM) Babcock/Herrington Chen/Koh Wennemuth
1950s: The Cambridge school • Are ions free in the cytoplasm or are they bound?
H-K meth blue How fast do molecules diffuse in axons? before 3 s 20 s 120 s 600 s 700 mm Methylene blue is injected into a squid axon along its axis. 15 s After injection, spread of dye in one dimension (r) would follow the Einstein equation approximately ("bell-shaped" Gaussian distribution): C(x,t) = Const. * (1/t) * exp –(r2/2Dt) SD = = sqrt(2Dt) From this and dye data: find that D for a dye in axon is 1.5*10–6 cm2/s, compared to 4*10–6 cm2/s for dye in water. (Hodgkin & Keynes, 1956) Generalization: In cells D is typically ½ of free-solution value so Gcyto= Gext / 2
H-K Ca45 spread 45Ca2+ diffusion in axons Hodgkin & Keynes, 1957 14 min axon 478 min gamma counts –4 –2 0 2 4 6 distance r (mm) 45Ca2+ is injected into a short stretch of axon and its longitudinal diffusion gives an effective diffusion constant C(x,t) = Const. * (1/t) * exp –(r2/2Dt) DCa in axon = ~0.4*10–6cm2/s compared to 6*10–6 cm2/s in water.
Difffsion w. binding Clearance is slowed too Binding slows diffusion DCa DCa DCa DCa DCa Caf(1) k Cabound = k Caf(1) immobile Caf(2) k Cabound = k Caf(2) immobile Caf(3) k Cabound = k Caf(3) immobile Caf(4) k Cabound = k Caf(4) immobile k is the "calcium binding ratio" Free particles diffuse at their normal free rate DCa, but the total population diffuses more slowly. The total population diffuses at a rate DCa/(1 + k), if the bound complex can't move, or, more generally: Dfree + kmobile * Dbound,mobile (1 + kmobile + kimmobile)
A family of Ca2+-sensitive switches and buffers Calmodulin Parvalbumin is present in GABAergic interneurons in the nervous system especially the reticular thalamus] and chandelier and basket cells in the cortex. In the cerebellum, PV is expressed in Purkinje cells and molecular layer interneurons.] Most of the PV interneurons are fast-spiking. They are also thought to give rise to gamma waves recorded in EEG..... Calbindin-D28kis present in the intestine, kidney. and a number of neuroendo-crine cells, particularly in the cerebellum. Cerebellar Pukinje cells. Calretinin CR is in interneurons of granule cell layer (Antisense cerebellar images from Allen Brain Atlas, http://www.brain-map.org/)
GonadoModel Buffers of a pituitary gonadotrope? GnRH GnRHR Gq PLC DAG PLC IP3 ER IP3R LH FSH Ca2+ LH FSH Mitoch. LH FSH Ca K(Ca) exocytosis
GonadoCaBookkeep Estimating Ca2+ binding ratios cytosol ER stores mitochondria Approx. volume 1 0.1 0.06 D free (mM) 1 10 0.4 D bound (mM) 100 1000 1700 ratio bound/free(k) 100 100 4000 calmodulin chaperones proteins??? calretinin calreticulin PO4 calbindin calnexin phospholipid? parvalbumin BIP annexins calsequestrin Candidate buffers: The calculations combine experiments with gonadotropes and chromaffin cells
Interlude for discussing Augustine/Neher paper Discussion of Neher/Augustine paper"Calcium gradients and buffers in bovine chromaffin cells"Each figure will be fully described by a student--as if you are teaching it to us for the first time. Further questions will come from the audience. Purpose of paper Bertil Fig. 4 Jerome Cattin Fig. 5 Jacob Baudin Fig. 6 Andrea McQuate Fig. 7 Jesse Macadangdang Fig. 8 Benjamin Drum Fig. 9 Anastasiia Stratiievska
Fig 4 Jerome Cattin AN4 100 ms 300 ms 500 ms 1,000 ms after end 10,000 ms after end
AN5 Fig 5 Jacob Baudin rest level
Diffusion into a sphere of radius r Crank in sphere x = 0, center of sphere x = r, edge of sphere Modeled times are given in multiples of the diffusional characteristic time: r2 / D For example, if a cell has radius r = 9 mm and the free diffusion coefficient is 4 * 10–6 cm2/s as for small ions. Then r2/D is 20 ms, and for the red curve labeled 0.15: t = 0.15 r2/D = 0.15x20 ms corresponds to 3 ms. 0.15 distance from center of sphere (Crank, The Mathematics of Diffusion, Oxford, 1956) see also Carslaw & Jaeger, The Conduction of Heat in Solids, Oxford
AN & Crank Rough guesstimate of Ca2+ diffusion rate Since Ca takes perhaps 50-100 ms instead of 3 ms to reach the 0.15 curve, it might be ~30 times less mobile than free Ca in this chromaffin cell experiment with EGTA & fura.
AN6 Fig. 6 Andrea McQuate 500 ms Fura rest level
Fig 7 Jesse Macadangdang AN7 Fura 250 ms ICa Fura 500 ms
Indo Binding Ratio Binding ratios depend on indo and Ca concentrations as well as endogenous buffer Ca bound to indo = cindo/(1+Kindo/Cai) suppose endogenous k = 100, then added indo-1 increases k above 100 k = 100+ (cindo/Kindo)/(1+Cai/Kindo)2 600 mM 300 Kindo ~ 200 nM Differential Ca binding ratio (k) 500 mM 200 400 mM of added indo-1 100 0 mM [Ca2+]i (mM)
AN8 Fig 8 Benjamin Drum 400 uM fura-2 t = 190 s Inset back to 50 uM fura-2
AN9 ? ? Fig 9 Anastasiia Stratiievska (seconds) decay (s) 7 s -89 Fura-2 Ca binding ratio (kB)
Conclusions : Binding = buffering & sensing Buffering reduces Ca2+ changes, Slows Ca2+ changes, Slows diffusion, Shortens local spikes of Ca2+