Download
1 / 30
300 likes | 500 Views
Pbio550: Biophysics of Ca 2+ signaling ( http://courses.washington.edu/calcium/ ). Class objectives: Discuss the basics of fluorescence Discuss the differences between single- and dual-wavelength fluorescent Ca 2+ indicators

E N D
Pbio550: Biophysics of Ca2+ signaling(http://courses.washington.edu/calcium/) Class objectives: Discuss the basics of fluorescence Discuss the differences between single- and dual-wavelength fluorescent Ca2+ indicators Discuss a series of important considerations in the selection of fluorescent indicators Learn how to calibrate fluorescence signals
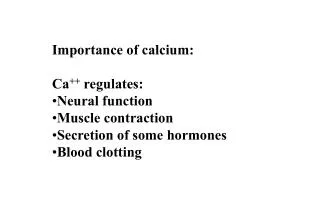
What is fluorescence? Fluorescence is the property of emitting electromagnetic radiation in the form of light as the result of (and only during) the absorption of light from another source. Important characteristics of fluorescence: 1. It is the result of the absorption of light. 2. It occurs during absorption only. 3. It involves the emission of light. 4. An outside source of energy is required.
Energetic Transitions of Electrons During Fluorescence • Lifetime of electrons in excited state is short: 10-13 (absorption) and 10-9 s (emission).
Types of fluorescent Ca2+ indicators Single wavelength indicators: changes in Ca2+ cause changes in the intensity of the emission spectrum of the indicator. Examples: Fluo-3, Fluo-4, Calcium green, Rhod-2 Emission spectrum is generated by exciting at a fixed wavelength while emission is monitored over a range of wavelengths. Excitation Emission Excitation spectrum is generated by measuring fluorescence emission intensity at fixed wavelength while excitation light is varied.
Emission of Fluo-3 at Varied [Ca2+] Note that upon binding Ca2+, fluo-3 only increases its emission fluorescence intensity.
Dual wavelength indicators: variations in Ca2+ elicit changes in the intensity of the emission or excitation spectra of the indicator. In addition, the Ca2+-bound and Ca2+-free form of the indicator have different spectra. Effects of [Ca2+] on the excitation Spectra of Fura-2 Note that upon binding Ca2+, Fura-2 increases its emission at 510 nm during 340 nm excitation. As Ca2+ increases emission at 510 nm decreases with 380 nm excitation.
Important considerations in the selection of fluorescence indicators Quantum efficiency (Q) Probability of re-emitting a photon. Q Practical implications: brightness and dynamic range. Low - High
Important considerations in the selection of fluorescence indicators (cont.) Extinction co-efficient (e) P0 P Absorbance (A) = log10 P0/P Constant Emitter A = e*b*[compound] Beer-lambert law Path length (b) Extinction co-efficient (e) A measure of the rate of the reduction of transmitted light through a substance. Indicates the efficiency with which the fluorochrome absorbs the excitation light.
e (cm-1 M-1) Fluo-4 Fluo-4 100,000* Absorbance Fura-2 34,000* Fura-2 * = At saturating [Ca2+] [Dye] Linear relationship between dye concentration and absorbance at low [dye] (Beer-Lambert law) A = b [Dye] Brightness = e* Q
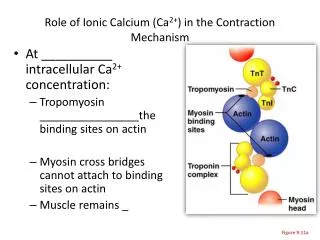
Indicators vary in their selectivity for Ca2+ Can the indicator distinguish different divalent ions? Mag-Fura-2 Ca2+ Kd = 25 mM Mg2+ Kd = 1.9 mM Fura-2 Ca2+ Kd = 220 nM Mg2+ Kd = 9.8 mM
Larger changes in fluorescence produced by a change [Ca2+] near the Kd of the indicator Ca2+ + Indicator Ca2+-Indicator Kd [Ca2+] * [Indicator] Kd = [Ca2+-Indicator]
Larger changes in fluorescence produced by a change [Ca2+] near the Kd of the indicator KCa Ca2+ + Indicator Ca2+-Indicator [Ca2+-Indicator] KCa = [Ca2+] * [Indicator] [Indicator]total = [Indicator] + [Indicator-Ca2+] [Ca2+-Indicator] [Indicator] KCa = * [Ca2+] * [Indicator] [Indicator]total - [Ca2+-Indicator] [Indicator]total [Ca2+-indicator] = 1 + (1/KCa * [Ca2+])
[Indicator]total [Ca2+-indicator] = 1 + (1/KCa * [Ca2+]) [Indicator]total [Ca2+-indicator] = [ ] 1 1 + (1/Kd)*[Ca2+] Larger changes in fluorescence produced by a change [Ca2+] near the Kd of the indicator Since KCa = 1/Kd
Important considerations in the selection of fluorescence indicators (cont.) • Intracellular Buffering • Cytototoxicity • Autofluorescence • Bleaching and Ca2+-insensitive forms • Selectivity • Leakage • Compartmentalization • Introduction into cells
Loading cells with Fluorescent Indicators Penta-sodium salt of Fura-2 Fura-2 AM Requires micro-injection Passive loading
Summary Factors Determining the Intensity of the Fluorescent Signal 1. Concentration of the fluorescent indicator. 2. Detector sensitivity, instrumental efficiency in collecting photons. 3. Quantum efficiency 4. Extinction coefficient
Light Path in an Inverted Microscope Designed to detect Fura-2 signals
Note decrease in fluorescence Experimental Fura-2 Data Note how problems associated with photo-bleaching and variation in dye concentration are eliminated by obtaining a ratio.
Asante Ca2+ Red: a new ratiometric Ca2+ indicator that can be used with a confocal microscope • Teflabs (www.teflabs.com) • Kd = 400 nM • 50-fold increase in fluorescence from 0 to saturating Ca2+ levels.
[Ca2+]i (nM) Fluorescence Non-linear relationship between [Ca2+] and fluorescence
R—Rmin Sf2 [Ca2+] = Kd Rmax—R Sb2 Calibration of ratiometric indicators From Grynkiewicz et al. 1985 • For fura-2: • R = F340/F380 Sf2 = Ca2+-free fluorescence intensity at wavelength 2 (380 nm) Sb2 = Ca2+-bound fluorescence intensity at wavelength 2 (380 nm)
Calibration of single-wavelength indicators using the pseudo-ratio method (Cheng et al. 1993) [Ca2+]i = Kd(F/F0)/[Kd/[Ca2+]rest + 1 - F/F0] Calibrated signal Raw data F [Ca2+]i (nM) BKG subtracted Pseudoratio F F0 F/F0 {
Calibration of single-wavelength indicators using Fmax (Maravall et al. 2000) Can be obtained in vitro Scaling factor Obtained experimentally
Other Ca2+ indicators 1. Quin-2one of the first Ca2+ indicators developed by Tsien. Quin-2 has e and f values much lower than the fura-2, indo-1, fluo-3, fluo-4 and Calcium Green indicators and thus requires higher loading concentrations. The resulting high intracellular concentration of the indicator may buffer intracellular Ca2+ transients. 2. Antipyrylazo III and Arsenazo III absorbance indicators, low Ca2+ selectivity 3. Aequorins luminescent protein; i.e. emits light upon Ca2+ binding. Thus, excitation light is not required. Difficulties include introduction into cells and low light output. One particular advantage is that it has a wide dynamic range. Still used in used for targeted measurements.
Fig. 3 Andrea
Fig. 4 Jacob
Fig. 5 Benjamin
Fig. 6 Jesse
Fig. 7 Jesse