Methods of Making Comparisons in Hypothesis Testing
Learn about hypothesis testing, experimental design, sample mean inferences, errors in testing, and cross-tabulation methods in making comparisons.

Methods of Making Comparisons in Hypothesis Testing
E N D
Presentation Transcript
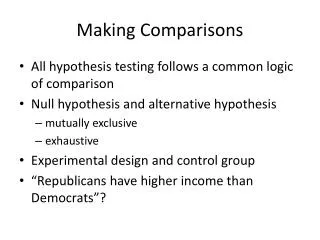
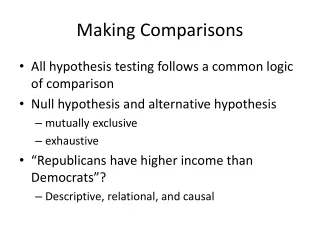
Making Comparisons • All hypothesis testing follows a common logic of comparison • Null hypothesis and alternative hypothesis • mutually exclusive • exhaustive • “Republicans have higher income than Democrats”? • Descriptive, relational, and causal
Experimental Design • Draw a random sample • Manipulate the independent variable through treatment or intervention • Random assignment into experimental and control groups • Control (keep constant) other outside factors • Observe the effect on the dependent variable
Inferences about Sample Means • Hypothesis testing is an inferential process • Using limited information to reach a general conclusion • Observable evidence from the sample data • Unobservable fact about the population • Formulate a specific, testable research hypothesis about the population
Null Hypothesis • no effect, no difference, no change, no relationship, no pattern, no … • any pattern in the sample data is due to random sampling error
Errors in Hypothesis Testing • Type I Error • A researcher finds evidence for a significant result when, in fact, there is no effect (no relationship) in the population. • The researcher has, by chance, selected an extreme sample that appears to show the existence of an effect when there is none. • The p-value identifies the probability of a Type I error.
Cross-tabulation • Relationship between two (or more) variables • Joint frequency distribution • Contingency table • Observations should be independent of each other • One person’s response should tell us nothing about another person’s response • Mutually exclusive and exhaustive categories
Cross-tabulation • If the null hypothesis is true, the independent variable has no effect on the dependent variable • The expected frequency for each cell
Expected Frequency of Each Cell • Expected frequency in the ith row and the jth column ……… (Eij) • Total counts in the ith row ……… (Ti) • Total counts in the jth column ……… (Tj) • Total counts in the table ……… (N)
Observed frequencies: • Expected frequencies:
Chi-square (X2) • For each cell, calculate: • (observed frequency - expected frequency)2 expected frequency • Add up the results from all the cells
Measures of Association • Symmetrical measures of association • e.g. Kendall’s tau-b and tau-c • Asymmetrical measures of association • e.g. lambda and Somer’s d • Directional measures of association • e.g. Somer’s d • PRE measures of association • e.g. lambda and Somer’s d