Useful material for the course
100 likes | 275 Views
Useful material for the course. Suggested textbooks: Mood A.M., Graybill F.A., Boes D.C., Introduction to the Theory of Statistics. McGraw-Hill, New York, 1974. [very complete]

Useful material for the course
E N D
Presentation Transcript
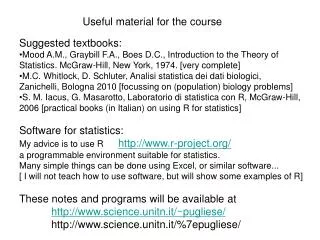
Useful material for the course • Suggested textbooks: • Mood A.M., Graybill F.A., Boes D.C., Introduction to the Theory of Statistics. McGraw-Hill, New York, 1974. [very complete] • M.C. Whitlock, D. Schluter, Analisi statistica dei dati biologici, Zanichelli, Bologna 2010 [focussing on (population) biology problems] • S. M. Iacus, G. Masarotto, Laboratorio di statistica con R, McGraw-Hill, 2006 [practical books (in Italian) on using R for statistics] • Software for statistics: • My advice is to use R http://www.r-project.org/ • a programmable environment suitable for statistics. • Many simple things can be done using Excel, or similar software... • [ I will not teach how to use software, but will show some examples of R] • These notes and programs will be available at • http://www.science.unitn.it/~pugliese/ • http://www.science.unitn.it/%7epugliese/
Some problems that can be tackled with inferential statistics • Can I say whether the experimental group has a lower risk of heart attack than the control group? or has a lower blood pressure? and of how much? • How large should I choose the two groups to be able to detect an effect of treatment? • Which is the precision associated to a measurement performed? • Is there a (linear) relationship between chlorophyll concentration and photosynthetic rate? • These questions involve experimental design and mathematics. I will (almost) only deal with the latter.
Description of continuous variables Box-plot
Reading box-plots Box-plot A useful tool to summarize information on the distribution of a variable (we can put many side by side) outliers normal range median 3rd quartiles 1st
A “non-parametric” estimation of a continuous density from data
Visually comparing a distribution to a normal (Q-Q plots) compares theoretical quantiles (those of a standard normal) to observed quantiles. If data were normally distributed, points should lie on a line (a line is added to help visual impression)
Summary of methods in ` • univariate descriptive statistics • Mean, variance, median (summary indices) • Quantiles … • Histogram, box-plots • Empirical density • Comparison with a normal distribution • Q-Q plot (to compare two distributions, in particular data with a normal) • Thumb rule: approximately 2/3 of a distribution lies between E(X)-sqrt(V(X)) and E(X)+sqrt(V(X))