Download
1 / 20
200 likes | 341 Views
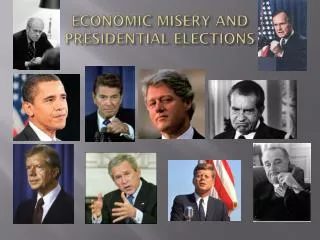
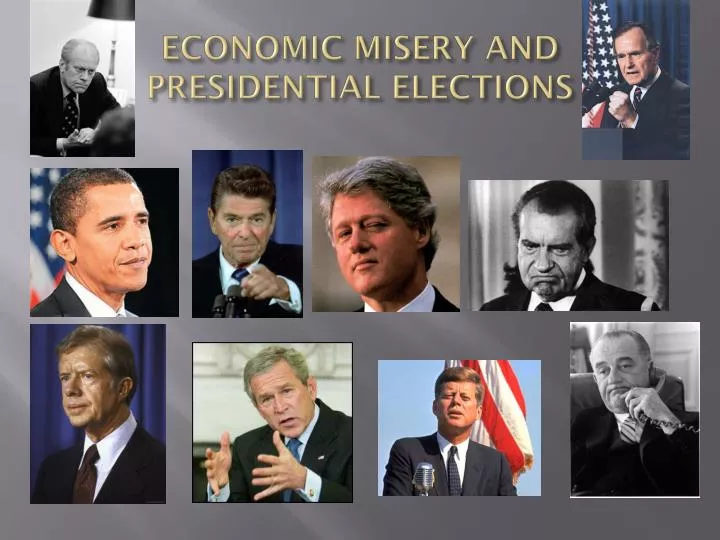
ECONOMIC MISERY AND PRESIDENTIAL ELECTIONS. THE THREE MOST IMPORTANT ISSUES IN A PRESIDENTIAL ELECTION.

E N D
THE THREE MOST IMPORTANT ISSUES IN A PRESIDENTIAL ELECTION • Directions: Ask an adult of voting age (18 years of age or older) the following three-part question. (This adult can be a family member, a guardian, a friend, a relative, a co-worker, or anyone else who may be willing to share his or her views about important issues in a presidential election. Make sure to indicate that you are NOT asking whether the interviewee plans to vote, or has voted in a prior election. You are also NOT asking for whom the interviewee has voted in the past, or may support in the future.) • The question: Please indicate the three issues that are most important to you as you decide who will get your vote in a U.S. presidential election. • Issue 1: _________________________________________________________________ • Issue 2: _________________________________________________________________ • Issue 3: _________________________________________________________________
Business Cycle PEAK PEAK Inflation “Too much money” GROWTH TREND Expansion Contraction Expansion Contraction TROUGH Level of business activity Business Cycle Trough Unemployment Time
CAN A PRESIDENT TAME THE BUSINESS CYCLE? • http://www.nytimes.com/interactive/2008/10/18/business/20081019-metrics-graphic.html • http://www.portfolio.com/interactive-features/2008/01/Economics-of-Presidency As important as the economy may be for voters when they go to the polls, many economists contend that presidents have little power over general economic performance during their terms of office, even though some things, like the minimum wage, are set by the government.
SOME KEY ECONOMIC INDICATORS • Unemployment Rate: The percentage of people in the labor force who are unemployed. • Inflation Rate: The percentage increase in the overall price level. • Real GDP: the value of all final goods and services produced in a country in a year, expressed in terms of constant dollars. • TWO STATISTICS BASED ON THESE INDICATORS • Misery Index: The sum of the unemployment rate and the inflation rate. • Growth rate in real GDP per capita: The percentage change in real GDP per person.
Survey on Unemployment BLS calls 60,000 households every month. They ask three questions: 1. Are you working? If the answer is no, 2. Did you work at all this month-even 1 day? You are a member of the LF if “yes” on 1 or 2. 3. Did you look for work during the last month? [agency, resume, interview] A “yes” counts you as part of the LF. A “no” means you are not counted. You are a “discouraged worker.” The labor force consists of the employed and unemployed.
Inflation Since 1954 Inflation – overall increase in prices Deflation – decrease in prices (1954) Disinflation – decrease in inflation(1980-83)
Real GDP and the Last Few Recessions Billions of 1996 Dollars $10,000 9,000 8,000 7,000 6,000 5,000 4,000 3,000 1970 1975 1980 1985 1990 1995 2000
Misery Index Inflation Rate + Unemployment Rate = Misery Index Arthur Okun developed the economic “discomfort index” to summarize the “health of the economy.” Jimmy Carter used it against Gerald Ford and won. Ronald Reagan used it against Carter(20%) and won. Inflation Rate Unemployment Rate Arthur Okun
GDP Over The Decades 13 tril. 13.8 tril. Per Capita $46,000 12 tril. 10 tril. 9 tril. 8 tril. 7 tril. 6 tril. 5 tril. 4 tril. 3 tril. 2 tril. 1 tril. 0 [If GDP increases, per capita income increases] 4,152 3,187 2,416 1,665 1,204 773 709 1929 1940 1950 1960 1970 1980 1990 2007
AN ECONOMIC RULE THAT DOES NOT WORK WELL A Real GDP per capita growth rule: The incumbent party usually wins if . . . The growth rate of real GDP per capita is greater than 0% during the year of the election.
SOME ECONOMIC RULES THAT WORK WELL A Real GDP per capita growth rule: The incumbent party usually wins if . . . • The growth rate of real GDP per capita is greater than or equal to 2.5% during the year of the election. A Misery Index rule: The incumbent party usually wins if . . . • The Misery Index has not increased from the year prior to the election. A Guaranteed Loss Rule: The incumbent party has always lost if • the real GDP per capita growth is less than 2.5% AND • the misery index has increased from the year prior to the election to the year of the election.
1956: Eisenhower 57.4%, Stevenson 42.0% Real GNP growth (Economy):Two Year: 4.54%Four Year: 3.25%Previous Administration: 4.95% Unemployment Rate (Jobs):Two Year: 4.25%Four Year: 4.25%Previous Administration: 4.36% Although Eisenhower won in a landslide, the Economy had actually performed better under the Truman administration than it did during Eisenhower's first term. Real GNP, however, grew at an amazing 7.14% per year in 1955, which certainly helped Eisenhower get reelected.
1984: Reagan 58.8%, Mondale 40.6% Real GNP growth (Economy):Two Year: 5.85%Four Year: 3.07%Previous Administration: 3.28% Unemployment Rate (Jobs):Two Year: 8.55%Four Year: 8.58%Previous Administration: 6.56% Reagan won in a landslide, which certainly had nothing to do with the unemployment statistics. The economy came out of recession just in time for Reagan's reelection bid, as real GNP grew a robust 7.19% in Reagan's final year of his first term.
1996: Clinton 49.2%, Dole 40.7% Real GNP growth (Economy):Two Year: 3.10%Four Year: 3.22%Previous Administration: 2.14% Unemployment Rate (Jobs):Two Year: 5.99%Four Year: 6.32%Previous Administration: 5.60% Not quite a landslide, we see quite a different pattern than the other two incumbent victories. Here we see fairly consistent economic growth during Clinton's first term as President, but a consistently improving unemployment rate. It would appear that the economy grew first, then the rate of unemployment decreased, which we would expect since the unemployment rate is a lagging indicator.
THE THREE INCUMBENTS THAT WON Incumbent 55.1%, Challenger 41.1% Real GNP growth Two Year: 4.50%Four Year: 3.18%Previous Administration: 3.46% Unemployment Rate (Jobs):Two Year: 6.26%Four Year: 6.39%Previous Administration: 5.51% It would appear then from this very limited sample that voters are more interested in how the economy has improved during the tenure of the presidency than they are in comparing the performance of the current administration with past administrations.
FORD, CARTER, AND G.H.W. BUSHTHREE INCUMBENTS WHO LOST • Incumbent 42.3%, Challenger 48.0% • Real GNP growth (Economy):Two Year: 1.87%Four Year: 2.67%Previous Administration: 3.12% • Unemployment Rate (Jobs):Two Year: 6.97%Four Year: 6.56%Previous Administration: 6.50%