Download
1 / 26
260 likes | 356 Views
0. Presidential and Congressional Elections. November 12, 2007. Voter Turnout. U.S. turnout in comparative perspective Lower for congressional elections than Presidential elections Decline in voter turnout How low is it? Does it matter? The role of age and education.

E N D
0 Presidential and Congressional Elections November 12, 2007
Voter Turnout • U.S. turnout in comparative perspective • Lower for congressional elections than Presidential elections • Decline in voter turnout • How low is it? Does it matter? • The role of age and education
Turnout in Comparative Perspective See also Fiorina et al. Table 6.1, p.140
Voting is the most common form of political participation • Many people also talk about politics and try to persuade others to vote • Very few participate in any other specific way.
The U.S. in Comparative Perspective Source: Comparative Study of Electoral Systems (CSES), Module 2, 2004
Why is voter turnout so low? • Electoral system • Voter attitudes • Lack of convenience • Difficulty of registration
0 Options for Electing the President • Congress chooses the president • State legislatures choose the president • President elected by popular vote • Electoral College
0 How it works • Each state was allocated a number of Electors equal to the number of U.S. Senators (always 2) plus the number of U.S. Representatives (which changes) • The manner of choosing the electors was left to the individual state legislators. By 1836 all states (except for South Carolina) choose electors by popular vote (plurality rules). • The person with a majority of electoral votes is elected president • In the event that no candidate wins a majority, the U.S. House of Representatives would choose from the top five contenders. Each state could cast only one vote. An absolute majority is required
0 2000 Presidential Election Bush 271; Gore 266 (270 needed to win)
0 Battleground States (2004) Bush 234 Kerry 207
0 2004 Presidential Election Results See results by state Bush 286 EV (51%)/ Kerry 252 EV (48%) 270 EV needed to win A change in Ohio (with 20 electoral votes) would have given Kerry the presidency even though Bush would have received a majority of the popular vote
Unequal Representation Source: Robert A. Dahl, How Democratic is the American Constitution?
0 Adjusting for State Population
0 Plurality Winners by County
0 Percentage of the vote for parties
0 The Florida Disaster • Florida recount (link to Univ. of Chicago study) • The punch card voting system • Design of the palm beach ballot
0 The Butterfly Ballot
0 Evidence of problems in Palm Beach
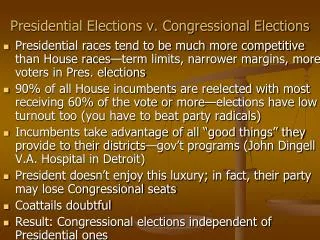
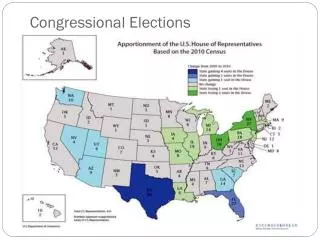
2006 Midterm Elections • Democrats win control of both the House and the Senate for the first time since 1994 • Democrats picked up 28 Seats in House (229 D/196 R) • Democrats picked up 6 Seats in the Senate (51 D including 2 Independents/49 R)
Midterm Losses • President’s party has lost House seats in every postwar midterm election until 1998 and 2002. • Since the end of WW II, the average midterm seat loss for the president’s party is 24 seats. • When the president’s approval rating is below 50% the average midterm seat loss is 38 seats.
Presidential Popularity and Congressional Outcomes in the Midterm Elections in a President’s Second Term