Download
1 / 19
190 likes | 339 Views
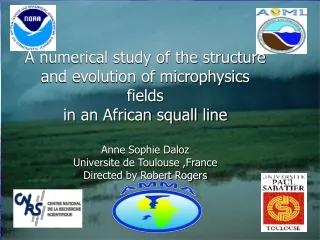
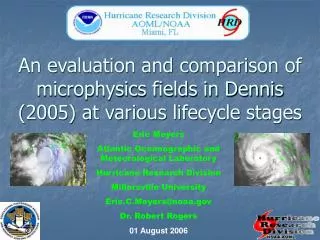
An evaluation and comparison of microphysics fields in Dennis (2005) at various lifecycle stages. Eric Meyers Atlantic Oceanographic and Meteorological Laboratory Hurricane Research Division Millersville University Eric.C.Meyers@noaa.gov Dr. Robert Rogers 01 August 2006. OUTLINE.

E N D
An evaluation and comparison of microphysics fields in Dennis (2005) at various lifecycle stages Eric Meyers Atlantic Oceanographic and Meteorological Laboratory Hurricane Research Division Millersville University Eric.C.Meyers@noaa.gov Dr. Robert Rogers 01 August 2006
OUTLINE • Background – A Brief Look Back at Dennis (2005) • An Incentive – Modeled v. Observed INTENSITY • Motivation • Methodology • Analysis/Findings • A qualitative comparison between OBSERVATIONS and MM5 SIMULATION of Dennis (2005) • A closer look at the microphysical evolution in the MM5 SIMULATION • A peek at a quantifiable comparison between OBSERVATIONAL precipitation probe data and MM5 SIMULATION • Summary • Future Assignments • Acknowledgements
Background – Dennis ‘05 • MM5 Simulation • Auto-moving inner nest capability • Goddard 3-class ice bulk microphysical parameterization scheme • Kain-Fritsch convective parameterization for 45- and 15-km grid meshes • No convective parameterization for 5- and 1.67-km grid meshes • NOAA P-3 Missions • Dropsondes • LF radar • Precipitation imaging probe Visible satellite imagery courtesy NRL-Monterey
Motivation • Advent of high-resolution models mandates a statistical means of comparing modeled microphysics with observations • To initiate the effort to improve: • Microphysical parameterization schemes • Simulated distributions of latent heat release (spatial and temporal) • Tropical cyclone intensity forecasts • Rainfall predictions • NOAA’s Strategic Plan Mission Goal 3 • “To serve society’s needs for weather and water information” • “Understand, Describe, Assess, & Predict”
Methodology • Qualitative Comparison • Attempt to validate model thermodynamics • Hypothesis • MM5 simulation exhibits various temporal differences in the distributions, averages, and gradients of microphysics fields during the organizational stage of Dennis (2005) • These quantifiable differences in microphysics can be statistically compared with observed fields of vertical velocity, reflectivity, and hydrometeor concentrations, with the intent to detect biases in the model • Statistical Model Analysis • Compare structural features and statistical distributions of hydrometeor mixing ratio, reflectivity, and vertical motion • “EARLY” - 18:00 Z 05 July 2005 through 00:00 Z 06 July 2005 (Tropical Storm Dennis – best track) • “LATE” – 06:00 Z 07 July 2005 through 12:00 Z 07 July 2005 (Hurricane Dennis – best track) • “Convective”, “Stratiform”, and “Other” • A Preliminary Quantitative Comparison • Precipitation imaging probe data v. simulated precipitation • Sampling volume v. model resolution
Qualitative comparison 13 dropsondes derived equivalent potential temperature 20:38-22:30 UTC 05 July 2005 950 hPa NOAA P-3 LF reflectivity 21:59 UTC 05 July 2005 650 hPa OBSERVATIONS MM5 derived equivalent potential temperature 21:00 UTC 05 July 2005 950 hPa MM5 reflectivity 22:00 UTC 05 July 2005 700 hPa SIMULATION
A LIMITED PERSPECTIVE… EARLY 22:00 UTC 05 July 2005 convective region 0°C Rainwater mixing ratio Graupel mixing ratio LATE convective region 09:00 UTC 07 July 2005
REFLECTIVITY EARLY bin size: 5 dBZ 11 km 18:00 UTC 05 July 2005 – 00:00 UTC 06 July 2005 Contoured Frequency by Altitude Diagrams (CFADs) CONVECTIVE REGIONS LATE bin size: 5 dBZ 11 km 06:00 UTC 07 July 2005 – 12:00 UTC 07 July 2005 Contoured Frequency by Altitude Diagram (CFAD)
Vertical Velocity EARLY 18:00 UTC 05 July 2005 – 00:00 UTC 06 July 2005 CONVECTIVE bin size: 1 m/s LATE 06:00 UTC 07 July 2005 – 12:00 UTC 07 July 2005 GRAUPEL CONVECTIVE REGIONS
INITIAL Quantitative comparison 01:58:49 Z - 02:01:23 Z 7 July 2005 mean T = 1.67 °C median T = 1.61 °C OBSERVATIONS SIMULATION ICE Precipitation Imaging Probe 6.4 mm RAIN
Summary • Set out to explore, both qualitatively and statistically, differences in the evolution of simulated microphysics fields • “EARLY” • “LATE” • Employed a unique statistical (and thus representative) framework for evaluating modeled microphysical parameterization schemes • Contoured Frequency by Altitude Diagrams (CFADs) • Mean profiles • Independent from observational data, determined that the MM5 simulation exhibits significant temporal variability in microphysics fields, through a unique vertical evolution of hydrometeor concentrations • Distributions of reflectivity and vertical motion are broader during “early” than during “late” period, especially above the melting level • Isolated “early” convective cores likely contribute to the majority of vertical mass transport, lofting super-cooled raindrops to higher levels and increasing graupel mixing ratio
Future assignments • To determine the statistical significance of differences evident in the prepared statistical analyses of modeled microphysics fields • To perform statistical analyses of observations: • Post-processed dropsonde data • Reliable microphysical probe measurements • Coordinated NOAA P-3 and NASA ER-2 Doppler velocities • To compare the temporal evolution of microphysics fields in the MM5 simulation (manifested in the statistical analyses I have prepared) with these observations • To pinpoint biases in the model • To evaluate the microphysical parameterization schemes • To continue simulations of Dennis (including an extension to the mature stage, when Dennis was over the eastern Gulf of Mexico), with specific efforts to improve the simulation of intensity • Ultimately, to use an enhanced modeling of microphysics to improve forecasts of tropical cyclone intensity and rainfall, an obvious benefit to public safety
Acknowledgements • Collaborators • Black, Robert - researcher HRD • Feuer, Steve - researcher HRD • Marks, Frank, PhD - director HRD • Ortt, Derek - graduate student RSMAS • Rogers, Robert, PhD - mentor and researcher HRD • Uhlhorn, Eric – researcher HRD • Valde, Krystal – CIMAS research associate • Papers • Cifelli, R., Peterson, W. A., Carey, L. D., & Rutledge, S. A. (2002). Radar observations of the kinematic, microphysical, and precipitation characteristics of two MCSs in TRMM LBA. J. of Geophysical Research, 107, 44-1-44-15. • Rogers, R. F., Black, M. L., Chen, S. S., Black, R. A. (2006). An evaluation of microphysical fields from mesoscale model simulations of tropical cyclones. Part I: Comparisons with observations. J. of Atmospheric Sciences, in review. • Yuter, S. E. & Houze, R. A. (1994). Three-dimensional kinematic and microphysical evolution of Florida cumulonimbus. Part III: Vertical mass transport, mass divergence, and synthesis. Mon. Wea. Rev., 123, 1946-1983.
THANKS FOR LISTENING! I now invite any ?s You may have!