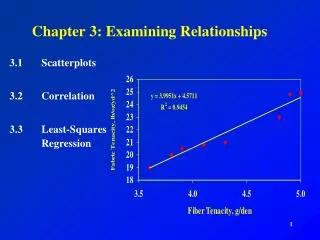
Chapter 2 Examining Your Data
Chapter 2 Examining Your Data. Examine Your Data!. Essential part of multivariate analysis. Helps with understanding of the data and relationships. Helps ensure assumptions are met and that missing data and outliers are handled appropriately.

Chapter 2 Examining Your Data
E N D
Presentation Transcript
Chapter 2 Examining Your Data
Examine Your Data! • Essential part of multivariate analysis. • Helps with understanding of the data • and relationships. • Helps ensure assumptions are met and • that missing data and outliers are • handled appropriately.
Description of Customer Survey Variables GINO'S Samouel's Restaurant VS. Variable DescriptionVariable Type Restaurant Perceptions X1 Excellent Food Quality Metric X2 Attractive Interior Metric X3 Generous Portions Metric X4 Excellent Food Taste Metric X5 Good Value for the Money Metric X6 Friendly Employees Metric X7 Appears Clean & Neat Metric X8 Fun Place to Go Metric X9 Wide Variety of menu Items Metric X10 Reasonable Prices Metric X11 Courteous Employees Metric X12 Competent Employees Metric Selection Factor Rankings X13 Food Quality Nonmetric X14 Atmosphere Nonmetric X15 Prices Nonmetric X16 Employees Nonmetric Relationship Variables X17 Satisfaction Metric X18 Likely to Return in Future Metric X19 Recommend to Friend Metric X20 Frequency of Patronage Nonmetric X21 Length of Time a Customer Nonmetric Classification Variables X22 Gender Nonmetric X23 Age Nonmetric X24 Income Nonmetric X25 Competitor Nonmetric X26 Which AD Viewed (#1, 2 or 3) Nonmetric X27 AD Rating Metric X28 Respondents that Viewed Ads Nonmetric
Examination Phases: • Editing, coding, transforming, etc. • Identify and deal with missing values. • Graphical examination. • Identify and deal with outliers. • Check whether statistical assumptions are met. • Preliminary understanding of data.
Editing: • Check for completeness and consistency. • Check data entry and coding (scale point meanings, dummy coding, etc.). • Transform data if necessary. • Be prepared to examine sample subgroups.
Missing Data: • Missing Data = information not available for a subject • (or case) about whom other information is available. • Typically occurs when respondent fails to answer one • or more questions in a survey. • Systematic? • Random? • Can distort results. • Strategies for handling missing data: • use observations with complete data only; • delete case(s) and/or variable(s); • estimate missing values.
Transform pull-down menu. Transforming – Summated Scores: Calculating Summated Scores with SPSS The restaurant perceptions variables on the Samouel’s customer survey include three measures related to the employees. They are variables X6, X11 and X12. To calculate the summated score, load the customer survey data (Customer Survey N = 200.sav). The click-through sequence is: TRANSFORM COMPUTE. First type a variable name in the Target Variable box. In this case we are calculating a summated score for the employee variables so let’s use the abbreviation Sum_Emp for Summated Employee. Next click on the Numeric Expression box to move the cursor there. Look below at the buttons and click on the parenthesis to place it in the Numeric Expression box (make sure cursor is between parentheses). Now highlight variable X6 and click on the arrow box to move it into the parenthesis. Go to the buttons below and click on the plus (+) sign. Go back and highlight variable X11 and click on the arrow box to move it into the parenthesis. Again click on the plus (+) sign. Finally, go back and highlight variable X12 and click on the arrow box to move it into the parenthesis. Now put the cursor at the right end of the parentheses and click on the divide sign (/) and then 3 to get the average. Next click on “OK” and you will get the average summated score for the three variables. You can find the new variable at the far right hand side of your data editor screen.
Transforming – Recoding: Use Transform pull-down menu. Click on recode into different variable. Create new variable name and label. Then click on Change. Input “Old and New Values”
Data pull-down menu. Examining Sample Subgroups: Using SPSS to Examine Sample Subgroups To split the sample, load the customer survey data (Customer Survey_N = 200.sav). The click-through sequence is: Data Split File. First click on the Data pull-down menu and scroll down and highlight and click on Split File. You will now see in the Split File dialog box where the default is Analyze all cases. Click on the Compare groups option, highlight variable X25 and click on the arrow box to move it into the Groups Based on: box. Next click on “OK” and you will be analyzing the competitor groups separately.
Dummy Variable • . . . . a nonmetric independent variable that has two (or more) distinct levels that are coded 0 and 1.
Dummy Variable Coding Category X1 X2 Physician 1 0 Attorney 0 1 Professor 0 0
Dummy Variable Coding Category X1 X2 X3 Physician 1 0 0 Attorney 0 1 0 Professor 0 0 1
Dummy Variable Coding X20 – Frequency of Patronage: 3 = Very Frequently (four or more times a month) 2 = Frequently (one to three times a month) 1 = Occasional (less than once a month)
Dummy Variable Coding X20– Frequency of Patronage Category X1 X2 X3 Very Frequently (3) 1 0 0 Frequently (2) 0 1 0 Occasional (1) 0 0 1
Dummy Variable Coding: X23 – Age1 = 18-25 2 = 26-34 3 = 35- 49 4 = 50-59 5 = 60 and older Category Xn Younger 0 (18-25, 26-34 & 35-49) Older 1 (50-59 & 60+)
How to determine “Dividing Point” when creating two-group dummy variable for X23 – Age?Possible approach: Apply ANOVA to perceptions variables using age as the independent (factor) variable and look for significance between perceptions for the various age groups. The differences between age groups shows dividing point is <50 and 50+. These are results for food perceptions variable X1, but all 12 perceptions variables should be considered.
Graphical Examination: • Shape: Histogram; Bar Chart; Box & Whisker plot;Stem and Leaf plot • Relationships: Scatterplot
How to Develop Bar Charts, etc. Using SPSS to Create Bar Charts, etc. The click- through sequence to prepare a bar chart for variable X17 – Satisfaction is: ANALYZE DESCRIPTIVE STATISTICS FREQUENCIES. Highlight X17 and click on the arrow box to move it into the Variables box. Click on Charts and Bar Charts, and then Continue. Next click on “OK” to execute the program. We have checked Histograms with normal curve.
How to Develop Box Plots Click on “Simple” Highlight variables and move them into this box. Click on “Summaries of separate variables” Box Plot = a visual display of the distribution’s location, spread, shape, tail length and outliers.
Samouel’s Diagnostics: Box & Whiskers Plots for Variables X17 , X18 & X19 The rectangular box in the middle includes 50 percent of the data values (two inner quartiles). The center line in the box is the median value. The straight lines that extend from the box are the whiskers – they go to the largest and smallest values in the data set, unless there are extreme values (outliers). Across the end of each whisker is a hinge. The hinge is located at the point that includes all data values that are within 1.5 times the interquartile range from either edge of the box. Any data values outside plus or minus 1.5 times the interquartile range is considered an outlier. Whisker Outlier = respondent #43 Hinge Two inner quartiles of data – the much larger size of the upper quartile shows there are many more respondents in it than in the lower quartile. Median
X17 -- Satisfaction Descriptive Characteristics for Variables X17 , X18 & X19 – Comparison of Samouel’s and Gino’ s Customers Frequencies Variables Values Samouel’s Gino’s X17 3 10 -- 4 42 7 5 16 28 6 24 27 7 8 38 Median = 4 6 X18 3 23 1 4 35 15 5 25 29 6 16 38 7 1 17 Median = 4 6 X19 3 31 -- 4 36 20 5 18 37 6 15 30 7 -- 13 Median = 4 5
Gino’s Diagnostics: Box & Whiskers Plots There is no upper whisker. This shows the distribution is skewed to the higher numbers. It also means there are 50 or more respondents in the two upper quartiles. The inner quartiles of data are about the same size for the upper and lower quartiles. This shows there are about the same number of respondents in both quartiles. Median Outlier = respondent #105
How to Develop Stem & Leaf Diagrams Click on the Explore option to get to the diagnostic box below. Click on the “Plots” box to get to Stem and Leaf. This is another way to do Box Plots.
Output from Stem & Leaf – Samouel’s Variable X18 Each stem is shown by the zeros, and each zero is a leaf. This stem has 23 leaves. The length of the stem, indicated by the number of leaves, shows the frequency distribution. For this stem, the frequency is 35. Indicates extreme values.
Outlier Outlier = an observation/response that is substantially different from the others; i.e., has an extreme value. Issue: “Is the observation/response representative of the population?”
Example: Impact of Outliers IndividualNet Worth – $Source Bill Gates 46.0 billion Microsoft Jeff Bezos 5.1 billion Amazon.com Craig McCaw 2.0 billion Telecommunications Number of households, Medina, Washington = 1206 Average Net Worth (1206 households) = $ 44,253,482 Average Net Worth (remove Bill Gates) = $ 6,115,934 Average Net Worth (remove top three) = $ 224,189 Source: Calculated from Forbes, 2003 and U.S. Census data
Dealing with Outliers: • Identify outliers. • Describe outliers. • Delete or Retain?
Identifying Outliers: • Standardize data and then identify • outliers in terms of number of • standard deviations. • Box Plots, Stem & Leaf, and Scatterplots. • Multivariate detection (D2).
Identifying Outliers: Box & Whiskers X18 -- Return in Future Stem-and-Leaf Plot for X25= Samouel's Frequency Stem & Leaf 23.00 3 . 00000000000000000000000 .00 3 . .00 3 . .00 3 . .00 3 . 35.00 4 . 00000000000000000000000000000000000 .00 4 . .00 4 . .00 4 . .00 4 . 25.00 5 . 0000000000000000000000000 .00 5 . .00 5 . .00 5 . .00 5 . 16.00 6 . 0000000000000000 1.00 Extremes (>=7.0) Stem width: 1 Each leaf: 1 case(s)
Multivariate Assumptions: • Normality • Linearity • Homoscedasticity • Non-correlated Errors • Data Transformations?
Testing Assumptions: • Normality assumptions • Visual check of histogram. • Kurtosis. • Normal probability plot. • Homoscedasticity • Equal variances across independent variables. • Levene test (univariate). • Box’s M (multivariate).
Running Skewness & Kurtosis Use Explore option. Under the Display box you can choose to get both statistics and plots or only one. Click on the Plots box to check options.
Skewness & Kurtosis: Skewness = measures departures from a symmetrical distribution. Skewness for a symmetrical curve = 0.Values greater than +1 or –1 indicate a problem. Kurtosis = measures the peakedness of a distribution. Kurtosis for a normal curve = 0. Values greater than +1.5 indicate a distribution is too peaked and below –1.5 indicate the distribution is too flat.
Running the Normality Option Use Explore option. Click on Plots to get the box shown below. Click on Statistics to request “Extreme Values”. Click on Normality plots to check normality of data.
Tests of Normality: Distributions of X18 for Samouel’s and Gino’s. Extreme values for X18.
Normality: These plots are only for Samouel’s. Gino’s plots are also on the output.
Simple Approaches to Understanding Data • Tabulation = a listing of how respondents answered all possible answers to each question. This typically is shown in a frequency table. • Cross Tabulation = a listing of how respondents answered two or more questions. This typically is shown in a two-way frequency table to enable comparisons between groups. • Chi-Square = a statistic that tests for significant differences between the frequency distributions for two (or more) categorical variables (non-metric) in a cross-tabulation table. Note: Chi square results will be distorted if more than 20 percent of the cells have an expected count of less than 5, or if any cell has an expected count of less than 1. • ANOVA = a statistic that tests for significant differences between two means.
Two Examples of Crosstabs To get these crosstabs, click on ANALYZE DESCRIPTIVE STATISTICS FREQUENCIES. Move the variables to be crosstabulated into the Variables box and click OK to run the software. Note that too many cells have an expected count of less than 5.
ANOVA Dialog Boxes To get these dialog boxes, click on: ANALYZE COMPARE MEANS ONE-WAY ANOVA. Move the variables into the Dependent List and Factor boxes. Then click on the Options box and check Descriptive under statistics and Continue. Now click OK.
ANOVA: Test of Differences in Group Means The mean of the males is larger than for females, which shows they are more likely to search. There are significant differences in “Intention to Search” between males and females.
Examining DataLearning Checkpoint: Why examine your data? What do we examine? What approaches do we use?
Samouel's Restaurant Description of Employee Survey Variables Variable DescriptionVariable Type Work Environment Measures X1 I am paid fairly for the work I do. Metric X2 I am doing the kind of work I want. Metric X3 My supervisor gives credit an praise for work well done. Metric X4 There is a lot of cooperation among the members of my work group. Metric X5 My job allows me to learn new skills. Metric X6 My supervisor recognizes my potential. Metric X7 My work gives me a sense of accomplishment. Metric X8 My immediate work group functions as a team. Metric X9 My pay reflects the effort I put into doing my work. Metric X10 My supervisor is friendly and helpful. Metric X11 The members of my work group have the skills and/or training to do their job well. Metric X12 The benefits I receive are reasonable. Metric Relationship Measures X13 Loyalty – I have a sense of loyalty to Samouel’s restaurant. Metric X14 Effort – I am willing to put in a great deal of effort beyond that expected to help Samouel’s restaurant to be successful. Metric X15 Proud – I am proud to tell others that I work for Samouel’s restaurant. Metric Classification Variables X16 Intention to Search Metric X17 Length of Time an Employee Nonmetric X18 Work Type = Part-Time vs. Full-Time Nonmetric X19 Gender Nonmetric X20 Age Nonmetric X21 Performance Metric
Description of Customer Survey Variables GINO'S Samouel's Restaurant VS. Variable DescriptionVariable Type Restaurant Perceptions X1 Excellent Food Quality Metric X2 Attractive Interior Metric X3 Generous Portions Metric X4 Excellent Food Taste Metric X5 Good Value for the Money Metric X6 Friendly Employees Metric X7 Appears Clean & Neat Metric X8 Fun Place to Go Metric X9 Wide Variety of menu Items Metric X10 Reasonable Prices Metric X11 Courteous Employees Metric X12 Competent Employees Metric Selection Factor Rankings X13 Food Quality Nonmetric X14 Atmosphere Nonmetric X15 Prices Nonmetric X16 Employees Nonmetric Relationship Variables X17 Satisfaction Metric X18 Likely to Return in Future Metric X19 Recommend to Friend Metric X20 Frequency of Patronage Nonmetric X21 Length of Time a Customer Nonmetric Classification Variables X22 Gender Nonmetric X23 Age Nonmetric X24 Income Nonmetric X25 Competitor Nonmetric X26 Which AD Viewed (#1, 2 or 3) Nonmetric X27 AD Rating Metric X28 Respondents that Viewed Ads Nonmetric
DESCRIPTION OF DATABASE VARIABLES Variable Description Variable Type PERCEPTIONS OF HATCO X1 Delivery speed Metric X2 Price level Metric X3 Price flexibility Metric X4 Manufacturer’s image Metric X5 Overall service Metric X6 Salesforce image Metric X7 Product quality Metric PURCHASE OUTCOMES X9 Usage level Metric X10 Satisfaction level Metric PURCHASER CHARACTERISTICS X8 Size of firm Nonmetric X11 Specification buying Nonmetric X12 Structure of procurement Nonmetric X13 Type of industry Nonmetric X14 Type of buying situation Nonmetric