Understanding Graphing Using X and Y Intercepts**
This guide explores the concept of graphing lines using x and y intercepts. Learn how to identify the x-intercept (the point where a graph crosses the x-axis) and the y-intercept (where it crosses the y-axis). The guide includes practical exercises: finding intercepts from given graphs and equations, including examples like y = 2x + 4 and -3x = 5y + 10. Additionally, understand how to graph lines from plotted intercepts and solve a real-world problem involving snow depth over days. This hands-on approach improves your graphing skills.

Understanding Graphing Using X and Y Intercepts**
E N D
Presentation Transcript
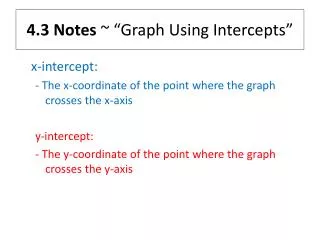
4.3 Notes ~ “Graph Using Intercepts” x-intercept: - The x-coordinate of the point where the graph crosses the x-axis y-intercept: - The y-coordinate of the point where the graph crosses the y-axis
II. Given an equation, find the x and y intercepts. • y = 2x + 4 4. 3x – 4y = 24 5. -3x = 5y + 10
IV. Given the Equation, find the intercepts then graph the line
V. Story Problem 3 inches of snow fell on the ground and every day one-half inch of snow melted. The equation to represent this is: Y = -(1/2)x + 3 (Where x represents days and Y represents inches of snow.) Find the x and y-intercepts and graph the line segment. Note: not a line What does the x-intercept represent? What does the y-intercept represent?