Strategies for Maximizing ROIC: A Deep Dive into Return on Invested Capital
140 likes | 162 Views
Learn how to boost ROIC through price premiums, cost efficiency, capital advantages, and scalability. Explore key strategies like customer lock-in, rational price discipline, and innovative business methods. Discover how sustainable ROIC drives long-term value creation.

Strategies for Maximizing ROIC: A Deep Dive into Return on Invested Capital
E N D
Presentation Transcript
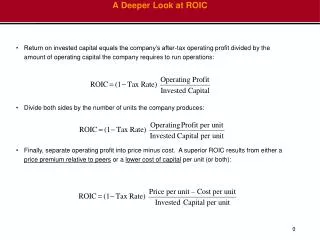
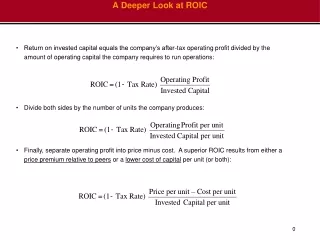
A Deeper Look at ROIC • Return on invested capital equals the company’s after-tax operating profit divided by the amount of operating capital the company requires to run operations: • Divide both sides by the number of units the company produces: • Finally, separate operating profit into price minus cost. A superior ROIC results from either a price premium relative to peers or a lower cost of capital per unit (or both):
Generating ROIC through Price Premiums • To sell a product at a price premium, a company must find a way to differentiate its products from those of competitors. Let’s consider five sources of price premiums: • Unique Products through Innovation: Innovative goods and services yield high returns on capital if they are protected by patents, difficult to copy, or both. • Pharmaceutical companies typically gain patents on new products, giving them 20 years with a market monopoly. • Apple’s iPod is an example of a non-patent-protected product that is difficult to copy because of its appealing design and branding, not necessarily its technology. • Real (or Perceived) Quality: Quality refers to any real or perceived difference between one product or service and another for which consumers are willing to pay a higher price. • In the car business, for example, BMW enjoys a price premium because customers perceive that its cars handle and drive better than comparable products that cost less.
3. Brand: A factor highly correlated and difficult to distinguish from quality, brand is especially important when no particular quality difference is present and customer loyalty to brands in a particular industry allows companies to charge higher prices for their products. • Strong brands allow cereal companies to earn ROIC of roughly 30 percent, while a lack of brand strength relegates meat processors to an ROIC of 15 percent. • 4. Customer Lock-In: Making the replacement costs expensive or impractical for consumers is an ideal way to lock in customers and keep ROIC high for a particular company. • Doctors who train on certain equipment, such as stents, usually have no compelling reason to go through the training process once more for a competitive product. • 5. Rational Price Discipline: In commodities industries, the laws of supply and demand can drive down prices and ROIC, but some industries are able to set prices (though it is illegal in many instances), and this can create elevated ROIC levels. • OPEC (Organization of Petroleum Exporting Countries) is the world’s largest and most prominent cartel and is able to set prices on oil (though a free-rider threat exists as there is tremendous incentive to lower prices and attract more sales). Price Premium Advantages: Strategy-Side
Driving ROIC through Cost and Capital Advantages • Cost efficiencyis the ability to sell products and services at a lower cost than the competition. • Capital efficiency is selling more products per dollar of invested capital than competitors. • Innovative Business Method includes a combination of a company’s production, logistics, and pattern of interaction with customers. • Dell’s unique and innovative method to sell directly to customers and keep minimal inventory by purchasing standardized parts from different suppliers at different times allowed it to outsell its competitors until the shift to notebook computers caused an industry-wide shock. • Unique Resources consist of the advantages proffered by access to something that cannot be replicated, such as a geographic location or a mine of natural commodities.
Economy of Scale refers to the notion that with greater size, cost savings are born (though usually at the regional or even local level, not in the national or global market). • Size plays the role of a barrier to entry;for example, any competitor to FedEx or UPS must pay the enormous fixed cost of building a nationwide network. • Profitability of health insurers is driven by their ability to negotiate prices with providers, usually doctors and hospitals (which tend to be local), and size is the key element in the ability to negotiate successfully. • Scalable Product Process represents the concept that supplying or serving additional customers is extremely low cost. Many companies use information technology (IT) to deliver such products and services in a scalable form. Because serving more customers is done at negligible cost, margins rise as sales rise—a huge boost for ROIC. Cost and Capital Efficiency Advantages: Scalability
ROIC Sustainability • The longer a company can sustain a high ROIC, the more value a company will create. • Length of Product Life Cycle directly affects the ability of a company to prolong its high ROIC benefits. • Microsoft and its Windows operating system, which has persisted for over a decade without stop, shows that a customer lock-in on a long product life cycle can have monumental effects. • Persistence of Competitive Advantage means that for a company that cannot prevent competition from duplicating its business practices, the ROIC gains will be short-lived. • When the cost improvement of self-service kiosks arose in the airline industry, it translated into directly lower prices for consumers and no ROIC change because every airline had access to these improvements. • Potential for Product Renewal is important because as product life cycles and ROICs decline, entry into new businesses or renewing existing businesses allows companies to revive their ROIC levels.
ROIC FOR NONFINANCIAL COMPANIES Percent Annual ROIC without goodwill Average 15.3 9.0 5.0 Years Annual ROIC with goodwill 13.6 8.3 4.7 Years Source: Compustat, McKinsey & Company’s corporate performance database
ROIC DISTRIBUTION FOR NONFINANCIAL COMPANIES Annual ROIC without goodwill, 1963-2003 Approximately 50% of the sample within ROIC range of 5-15% Percent of sample ROIC <-10.0 -5.0 0.0 2.5 5.0 7.5 10.0 12.5 15.0 17.5 20.0 22.5 25.0 30.0 35.0 40.0 >40.0 Percent of observations below ROIC level 5 7 11 15 25 42 56 66 74 80 84 87 89 92 94 95 100 84% of the sample had ROIC below 20% Source: Compustat, McKinsey & Company’s corporate performance database
ROIC BY INDUSTRY GROUP* Percent Annual ROIC without goodwill** 1963-2003 1994-2003 Pharmaceuticals and biotechnology Household and personal products Software and services Media Commercial services and supplies Semiconductors and semiconductor equipment Health care equipment and services Food, beverage, and tobacco Hotels, restaurants, and leisure Technology hardware, and equipment Automobiles and components Capital goods Food and staples retailing Consumer durables and apparel Retailing Total sample Materials Energy Transportation Telecommunication services Utilities * Based on S&P Global industry classification standard, excluding financial companies ** Average of annual medians Source: Compustat; McKinsey & Company’s corporate performance database
3.3 7.0 12.4 11.6 ROIC SEGMENTED BY SIZE AND GROWTH Annual ROIC without goodwill, 1963-2003 Percent Revenues 200-500 M 500-1,000 M 1,000-2,500 M <200 M >2,500 M 5.2 6.0 6.5 <0% 8.0 7.7 8.0 8.1 9.1 0-5% ROIC increases with higher growth rate 8.9 9.3 9.6 9.5 10.3 3-year real growth rate 5-10% 10.8 10.9 11.2 10.9 11.8 10-15% 11.9 11.1 11.7 11.5 11.9 15-20% 11.9 11.8 11.8 >20% No clear relation between size and performance Source: Compustat, McKinsey & Company’s corporate performance database
ROIC DECAY ANALYSIS: NONFINANCIAL COMPANIES Median ROIC of portfolio* Percent ROIC Percent >20 15-20 10-15 5-10 <5 Number of years following portfolio formation * At year 0, companies are grouped into one of 5 portfolios, based on ROIC Source: Compustat; McKinsey & Company’s corporate performance database
ROIC DECAY ANALYSIS: CONSUMER STAPLES Median ROIC of portfolio* Percent ROIC Percent >20 15-20 10-15 5-10 <5 Number of years following portfolio formation * At year 0, companies are grouped into one of 5 portfolios, based on ROIC Source: Compustat; McKinsey & Company’s corporate performance database
ROIC TRANSITION PROBABILITY, 1994-2003 Percent, 3-year average of ROIC without goodwill ROIC in 2003 Total ROIC in 1994 <5 5-10 10-15 15-20 >20 <5 100 5-10 100 10-15 100 15-20 100 >20 100 Source: Compustat; McKinsey & Company’s corporate performance database