Download
1 / 1
10 likes | 143 Views
Disease-free survival ( p =0.02). Overall survival ( p =0.011). Supplementary Fig. S11. Kaplan-Meir analysis comparing patients with chemosensitive with chemoresistant tumors for overall survival and disease free survival

E N D
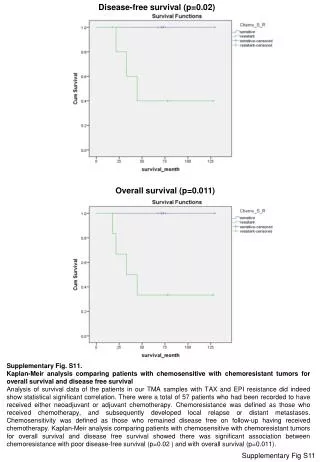
Disease-free survival (p=0.02) Overall survival (p=0.011) Supplementary Fig. S11. Kaplan-Meir analysis comparing patients with chemosensitive with chemoresistant tumors for overall survival and disease free survival Analysis of survival data of the patients in our TMA samples with TAX and EPI resistance did indeed show statistical significant correlation. There were a total of 57 patients who had been recorded to have received either neoadjuvant or adjuvant chemotherapy. Chemoresistance was defined as those who received chemotherapy, and subsequently developed local relapse or distant metastases. Chemosensitivity was defined as those who remained disease free on follow-up having received chemotherapy. Kaplan-Meir analysis comparing patients with chemosensitive with chemoresistant tumors for overall survival and disease free survival showed there was significant association between chemoresistance with poor disease-free survival (p=0.02 ) and with overall survival (p=0.011). SupplementaryFigS11