Data and Information Quality : Remote Sensing Level 2+ case
410 likes | 583 Views
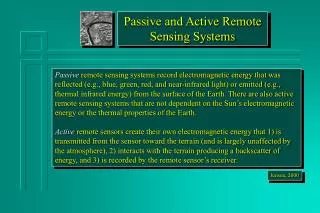
Data and Information Quality : Remote Sensing Level 2+ case. G. Leptoukh NASA Goddard Space Flight Center. Outline. Why so much attention to Data Quality (DQ) now? Why so difficult? Major challenge: perceived DQ vs. the actual DQ Level 3 Data provider vs. User perspective

Data and Information Quality : Remote Sensing Level 2+ case
E N D
Presentation Transcript
Data and Information Quality: Remote Sensing Level 2+ case G. Leptoukh NASA Goddard Space Flight Center
Outline • Why so much attention to Data Quality (DQ) now? • Why so difficult? • Major challenge: perceived DQ vs. the actual DQ • Level 3 • Data provider vs. User perspective • Data quality vs. Quality of Service • Quality Indicators (QI) for Remote Sensing (RS) Data: • Quality control/assurance vs. assessment • Technology to capture (ontology), ISO • Uncertainty/error budget • Validation • NASA efforts: Uncertainty Analysis program and other initiatives • ESIP IQ cluster • Recommendations Leptoukh, Pecora'11
Why so much attention to Data Quality now? • In the past, it was difficult to access satellite data. • Now, within minutes, a user can find and access multiple datasets from various remotely located archives via web services and perform a quick analysis. • This is the so-called Data Intensive Science. • The new challenge is to quickly figure out which of those multiple and easily accessible data are more appropriate for a particular use. • However, our remote sensing data are not ready for this challenge – there is no consistent approach for characterizing quality of our data. • This is why data quality is hot now. Leptoukh, Pecora'11
Why so difficult? • Quality is perceived differently by data providers and data recipients. • Many different qualitative and quantitative aspects of quality. • No comprehensive framework for remote sensing Level 2 and higher data quality • No preferred methodologies for solving many data quality issues • Data quality aspect had lower priority than building an instrument, launching a rocket, collecting/processing data, and publishing a paper using these data. • Each science team handled quality differently. Leptoukh, Pecora'11
Expectations for Data Quality • What do users want? • Gridded non-gappy data with error bars in each grid cell • What do they get instead? • Level 2 swath in satellite projection with some obscure quality flags that mean nothing to users • Level 3 monthly data with a lot of aggregation (not always clearly described) and standard deviation as an uncertainty measure (fallacy) Leptoukh, Pecora'11
Different perspectives Data providers: demigods looking from above MISR We have good data We have good data MODIS MLS OMI TES I need good new data … and quickly. A new data product could be very good, but if it is not being conveniently served and described, it is not good for me… So I am going to use whatever I have and know already. User Leptoukh, Pecora'11
Data provider vs. User perspective • Algorithm developers and Data providers: solid science + validation • Users: fitness for purpose • Measuring Climate Change: • Model validation: gridded contiguous data with uncertainties • Long-term time series: bias assessment is the must , especially sensor degradation, orbit and spatial sampling change • Studying phenomena using multi-sensor data: • Cross-sensor bias is needed • Realizing Societal Benefits through Applications: • Near-Real Time for transport/event monitoring - in some cases, coverage and timeliness might be more important that accuracy • Educational (generally not well-versed in the intricacies of quality) – only the best products Leptoukh, Pecora'11
Different kinds of reported and perceived data quality • Pixel-level Quality (reported): algorithmic guess at usability of data point (some say it reflects the algorithm “happiness”) • Granule-level Quality: statistical roll-up of Pixel-level Quality • Product-level Quality (wanted/perceived): how closely the data represent the actual geophysical state • Record-level Quality: how consistent and reliable the data record is across generations of measurements Different quality types are often erroneously assumed having the same meaning Different focus and action at these different levels to ensure Data Quality Leptoukh, Pecora'11
General Level 2 Pixel-Level Issues • How to extrapolate validation knowledge about selected Level 2 pixels to the Level 2 (swath) product? • How to harmonize terms and methods for pixel-level quality? AIRS Quality Indicators MODIS Aerosols Confidence Flags Ocean Land • Very Good • 2 Good • 1 Marginal • 0 Bad • Very Good • 2 Good • 1 Marginal • 0 Bad 0 Best Data Assimilation Good Climatic Studies Do Not Use Purpose Use these flags in order to stay within expected error bounds Match up the recommendations? Ocean Land Leptoukh, Pecora'11 ±0.05 ± 0.15 t ±0.03 ± 0.10 t
The Dubious Meaning of File-Level Quality Statistics Study Area Percent Cloud Cover? Leptoukh, Pecora'11
Quality Indicators (QI) for Remote Sensing (RS) Data: • We need to differentiate quality of Content: • the actual science geophysical values • from Service: • formats, metadata, documentation, archive, and delivery • Example of a generic QI completeness: • Content: spatial, temporal, spectral,… • Service: complete archive, full metadata, complete documentation, complete set of subsetting, … Leptoukh, Pecora'11
Data Quality vs. Quality of Service • A data product could very good, • But if not being conveniently served and described, is perceived as not being so good… User perspective: • There might be a better product somewhere but if I cannot easily find it and understand it, I am going to use whatever I have and know already. Leptoukh, Pecora'11
General Quality Indicators (QI) • These are objective (computable) aspects of data and provenance • Common across many disciplines • Some of them might be called ‘figures of merit” • Users of data, depending on usage, assert quality of data from these QI • The same QI might be consider “good” for one usage and “bad” for another – “somebody’s trash is another’s treasure” Leptoukh, Pecora'11
Data Quality Indicators (DQI) Leptoukh, Pecora'11
Remote Sensing Data Quality Indicators (DQI) Leptoukh, Pecora'11
QI: Spatial completeness (coverage): Aerosol Optical Depth (AOD) MODIS Aqua MISR Spatial coverage (%) for different latitudinal zones and seasons: Due to a wider swath, MODIS AOD covers more area than MISR. The seasonal and zonal patterns are rather similar Leptoukh, Pecora'11
ISO Information Quality Standards (19100 series) ISO 19131 • Details on specifications (including Amendment 1, TS 2010-05) ISO 19115 • Details on the reporting of quality assessment results as metadata ISO 19139 • Details on the implementation of metadata communication ISO 19157 (NEW) • Will essentially incorporate ISO 19113, 19114, and 19138 • ISO 19113 - Details the principles for quality evaluation • ISO 19114 - Details the description of quality assessment methodologies • ISO 19138 - Details the description of quality assessment methodologies • Scope establishes the concept of quality for geographic data, components for describing data quality, components and content structure of a register for data quality measures, general procedures for evaluating the quality of geographic data, and principles for reporting data quality • Also provides guidance on how to describe, evaluate, and report data quality • Does not attempt to define a minimum acceptable level of quality for geographic data Leptoukh, Pecora'11
Example of ISO Data Quality Leptoukh, Pecora'11
Example of ISO Usage Leptoukh, Pecora'11
Product Quality Ontology Concepts • Quality Property: aspect of quality • E.g. completeness, consistency, accuracy, representativeness • Quality Evidence: measurable quantity that can be used to provide clues into quality of the data • E.g. average daily spatial coverage • Quality Assertion: intuitive and ready-to-use expressions of quality (e.g. marginal, good, very good) computed from quality evidence • Data Entity: anything from which quality evidence can be computed • E.g., dataset, variable Leptoukh, Pecora'11
Product Quality Ontology Based on IQ Qurator Information Quality Model Leptoukh, Pecora'11
Average Daily Spatial Coverage By Region and Season in RDF Leptoukh, Pecora'11
Example of ISO to Ontology mapping Leptoukh, Pecora'11
Data provider quality indicators vs. user QI • EPA requirements for air pollution: • Very specific Quality Indicators, e.g., PM2.5 concentration • Satellite-measured aerosols are characterized by aerosol scientists. Aerosol Optical Depth (AOD) is not the same as PM2.5 • Are these quality indicators compatible? • Can one be mapped to another? • Does very accurate AOD measurement correspond to accurate PM2.5? Usually not… Leptoukh, Pecora'11
Quality presentation: QI • Table contains links to explanatory web pages • Processes organized as a list • Note: Data provenance presentation should be tailored to the audience • From the Multi-Sensor Data Synergy Advisor (MDSA) Leptoukh, Pecora'11
Sources of data quality information What do we want to get from the documentation? The known quality facts about a product presented in a structured way, so humans (and computers) can easily extract this information + links to data. • Algorithm Theoretical Basis Documents (ATBD): • More or less structured • Usually out-of-date • Represent the algorithm developer perspective • Describe quality control flags but does not address the product quality aspects • Regular papers: • To be published, a paper has to have something new, e.g., new methodology, new angle, new result. Therefore, by design, all papers are different to avoid rejection • Results are presented differently (usually without links for reliable data access) • Structured for publication in a specific journal – not standardized • Version of the data not always obvious while findings about the old version data usually are not applicable to the newest version Recommendation: • Establish a standard (maybe even a journal) for validation papers with links to data Leptoukh, Pecora'11
Level 2 uncertainty: error propagation vs. estimation • Error propagation through L2 retrieval (happens very rarely). Possible only when there are analytical formulae. Very difficult with thresholds and Lookup Tables. Input data errors usually unknown. • Error estimation (more often). Introducing Gaussian noise into algorithm parameters and input data and studying the spread. • Other non-black-box methods? Leptoukh, Pecora'11
Factors contributing to uncertainty and bias in L2 • Physical: instrument, retrieval algorithm, aerosol spatial and temporal variability, measuring geometry … • Input: ancillary data used by the retrieval algorithm • Classification: erroneous flagging of the data • Simulation: the geophysical model used for the retrieval • Sampling: the averaging within the retrieval footprint From the NASA SST study on error budget Leptoukh, Pecora'11
Is L3 quality different from L2 quality? • If L2 errors are known, the corresponding L3 error can be computed, in principle • Processing from L2L3 daily L3 monthly may reduce random noise but can also exacerbate systematic bias and introduce additional sampling bias • However, at best, standard deviations (mostly reflecting variability within a grid box), and sometimes pixel counts and quality histograms are provided • Convolution of natural variability with sensor/retrieval uncertainty and bias – need to understand their relative contribution to differences between data • This does not address sampling bias Leptoukh, Pecora'11
Why can’t we just apply L2 quality to L3? Aggregation to L3 introduces new issues where aerosols co-vary with some observing or environmental conditions: • Spatial: sampling polar areas more than equatorial • Temporal: sampling one time of a day only (not obvious when looking at L3 maps) • Vertical: not sensitive to a certain part of the atmosphere thus emphasizing other parts • Contextual: bright surface or clear sky bias • Pixel Quality: filtering or weighting by quality may mask out areas with specific features Leptoukh, Pecora'11
SST Error budget (from the white paper) Leptoukh, Pecora'11
Validation • Measures: correlation coefficient, slope, offset, percentage within Estimated Error (EE), … • “Compare and aggregate” vs. “Aggregate and compare” -> different results • Validation results usually are not collected, captured, and presented consistently amongst various teams • Validation data are not easily accessible • The challenge is to consolidate and harmonize validation data and the colocated satellite data • Good examples: Aura Validation Data Center and Aeronet at NASA GSFC Leptoukh, Pecora'11
Validation of Level 3 • The usual: • Level 2: regress against the truth • Level 3: aggregate and then regress against the aggregated truth? • Comparing a mean value in 1 deg grid box with data from stations in the same big area representativeness bias • Increasing aggregation: spatial over satellite data and temporal over station data – works well only for large homogenous fields • Comparing variance in the data with knowledge about atmospheric variability. Comparison of retrieved maps with climatology can indicate systematic effects • Comparison with models (how ironic!) for initial validation Doesn’t look comprehensive enough… Leptoukh, Pecora'11
Harmonization To be able to compare and/or merge data from multiple sources, we need to harmonize: • Quality Control flags • Provenance • Bias adjustment ….not addressed in this presentation to save time… Leptoukh, Pecora'11
Data Quality NASA Management Context • Data Quality Issue Premise • This issue has very high visibility • NASA recognizes the very real need for researchers and other interested parties to be exposed to explanatory information on data product accuracy, fitness of use and lineage. • NASA seeks to address this broad issue in concert with our US agency partners and other national space agencies and international organizations. • NASA's Data Quality Management Framework • Program Managers at NASA HQ stated their support for NASA pertinent projects, teams and activities to address data quality (most of these are funded activities). • NASA ESDIS Project is taking a leadership role for the agency in the coordination of persons and activities working data quality issues. To date: • Assembled a DQ team to develop strategies and products that further characterize DQ issues and coordinate/solicit for support for these issues. • Begun our agency coordination of DQ issues with our established interagency and international science and data system bodies. Leptoukh, Pecora'11 35
Data Quality NASA Management Context (White paper) • What's needed, what's next? • Our first step is to complete a near-term 'inventory' of current data quality mechanisms, processes and system for establishing and capturing data quality information. Initial focus in on existing projects who have established practices that are found to be of value to their specific user communities (success oriented). • From this base information a follow on set of documents will be developed around the gaps and 'tall pole' topics that emerge from the inventory process. These products will serve as a basis for organizing and coordinating DQ topics coupled to available resources and organizations to address these topics. • NASA intends to use currently planned meetings and symposia to further the DQ issue discussion and a forum for learning of other practices and community needs. • To make headway in DQ NASA is seeking interested partners in joining our established teams and/or helping us coordinate and collaborate with other existing teams working these issues. Leptoukh, Pecora'11 36
Specific NASA efforts • NASA Science Mission Directorate, Research Opportunities in Space and Earth Sciences 2010, Earth System Data Records Uncertainty Analysis : • Extend and enhance the use of Earth System Data Records, including Climate Data Records, through rigorous estimation of error in Earth System Data Records used by NASA communities. • Increase the science value of Earth System science measurements by identifying and validating systematic errors, and improving error estimations. • The scope of problems include estimating, validating, and conveying: • Measurement differences between sensors or between sensors, validation measurements and/or models; • Measurement errors in merged data products; • Systematic errors in long-term Earth system science data records; and • Other contributions to Earth science measurement quality and quantification of uncertainties. • The data methodologies or techniques employed by Earth System Data Records Uncertainty Analysis projects and their applicability to the problems being solved must be scientifically rigorous, peer-recognized, and substantiated. Leptoukh, Pecora'11
Specific NASA efforts, cont. • NASA Science Mission Directorate, Research Opportunities in Space and Earth Sciences ACCESS, ESTO, Making Earth Science Data Records for Use in Research Environments (MEaSUREs): • Specifically solicited proposal addressing provenance and uncertainty. • Consistently processed data across multiple sensors and missions • White paper on Product Quality Metrics • Examples: • ACCESS: “AeroStat: Online Platform for the Statistical Intercomparison of Aerosols” • ACCESS: “Data Quality Screening Service (DQSS)” • ESTO: “Multi-sensor Data Synergy Advisor” • White paper on SST Error budget • White paper on Quality of NASA Remote Sensing Data: • Assessment of DQ handling by different disciplines • Developing recommendations for future missions • Special 2010 & 2011 Fall AGU sessions on data uncertainty and quality Leptoukh, Pecora'11
Earth Science Information Partners (ESIP) Federation IQ cluster Objective: • to bring together people from various disciplines to assess aspects of quality of remote sensing data. • Learn and share best practices • Build a framework for consistent capture, harmonization and presentation of data quality for the purposes of climate change studies, earth science and applications. • ESIP Summer 2011 meeting, Santa Fe, NM Leptoukh, Pecora'11
Conclusion • Quality assessment of Level 2+ remote sensing data is very challenging • Various approaches to address some aspects of data quality are not consistently applied • A framework for consistent addressing quality of remote sensing data is needed • Various DQ efforts have started at NASA and other organizations Leptoukh, Pecora'11