Download
1 / 33
330 likes | 454 Views
2006 Census of Canada. Portrait of the Canadian P opulation in 2006, by Age and Sex. July 17, 2007. Portrait of the Canadian population, by age and sex. 1. National portrait 2. Provinces and territories 3. Urban and rural regions.

E N D
2006 Census of Canada Portrait of the CanadianPopulation in 2006, by Age and Sex July 17, 2007
Portrait of the Canadian population, by age and sex 1. National portrait 2. Provinces and territories 3. Urban and rural regions
Portrait of the Canadian population, by age and sex 1. National portrait 2. Provinces and territories 3. Urban and rural regions
More seniors, fewer children Number of children (0 to 14 years) and seniors (65 years and over) in Canada, 1956 to 2016 Observed Projected
Median age continues to increase Median age of the Canadian population, 1956 to 2006 Median age
One senior out of four is 80 years or over Number of persons aged 80 years and over and their share of the population aged 65 years and over, Canada 1956 to 2006
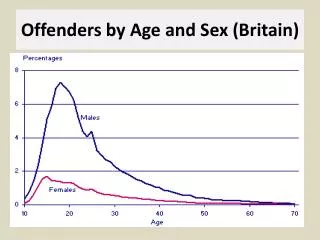
Women are more numerous than men at older ages Number of males for 100 females by age,Canada 2006 120 100 80 Males for 100 females 60 40 20 0 Age
Events centenarians have witnessed in their lifetime • Now 4,635 centenarians in Canada, 22% increase since 2001 • Some centenarians were born before 1900, and lived during three centuries
Canada among the youngest of the G8 countries Percentage of seniors (65 years and over) in the G8 countries, 2006 %
Fewer Canadians between 30 and 39 years; more between 55 and 64 Percentage change in the population by age groups between 2001 and 2006, Canada Canada Age
2.5 2.33 2.0 1.99 1.5 Ratio 15-24 / 55-64 1.15 1.0 0.5 0.0 1956 1961 1966 1971 1976 1981 1986 1991 1996 2001 2006 Years Barely enough persons entering the working ages to replace those leaving them Population aged 15 to 24 years as a proportion of the population aged 55 to 64 years, Canada, 1956 to 2006
Portrait of the Canadian population, by age and sex 1. National portrait 2. Provinces and territories 3. Urban and rural regions
Internal migration impacts the age structure of the provinces and territories • Alberta has been a strong attraction pole since 2001 • Young adults are overrepresented among the interprovincial migrants
All provinces are getting older Percentage of seniors (65 and over) by province and territory, 2001 and 2006 Canada 2006
A lower proportion of children in all provinces Percentage of children aged less than 15 by province and territory, 2001 and 2006 Canada 2006
Contrasts between provinces and territories: Newfoundland and Labrador and Nunavut Age pyramid of Newfoundland and Labrador and Nunavut, 2006
Alberta is the only province with more males than females Number of males for 100 females by province and territory, 2006 108 104 Males for 100 females 100 Canada 96 92
Portrait of the Canadian population, by age and sex 1. National portrait 2. Provinces and territories 3. Urban and rural regions
Internal migration impacts the CMAs and the rest of Canada’s age structures Net internal migration by age for CMAs and rest of Canada, 2001 to 2006 Age Source: Population estimates.
Persons aged 20 to 44 years old under-represented in non- metropolitan areas Age pyramid of metropolitan and non-metropolitan areas, Canada 2006
CMAs are younger. CAs, rural areas and small towns are older Percentage of seniors (65 and over) in the CMAs, CAs and rural and small towns, 2001 and 2006 Canada 2006 %
Nine of the sixteen youngest CMAs are located in the Greater Golden Horseshoe Percentage of children less than 15 years old by CMA, 2006 Canada %
Two of the three oldest CMAs are located in British Columbia Percentage of seniors (65 years and over) by CMA, 2006 Canada %
Contrast between CMAs: Calgary and Kelowna Age pyramid of Calgary and KelownaCMAs, 2006
Contrast between CAs: Parksville (B.C.) and Thompson (Man.) Age pyramid of Parksville and Thompson CAs, 2006
Montréal, the Greater Golden Horseshoe and Vancouver • More than 200 municipalities, some of them being more populated than CMAs : Laval, Mississauga, Surrey for example • Place of residence of most immigrants and to large numbers of young adults from the rest of the country
Five out of the ten older small towns and rural communities are located in British Columbia Small towns and rural communities* with the highest proportion of people aged 0 to 14 years Small towns and rural communities* with the highest proportion of people aged 65 years and over *5,000 inhabitants and more only
127 males for 100 females in Rockwood (Man.); 82 males for 100 females in Yarmouth (N.S.) Small town and rural communities* with the lowest number of males for each female Small town and rural communities* with the highest number of males for each female *5,000 inhabitants and more only
Upcoming 2006 Census releases • September 12, 2007: Marital status, families and households, housing • December 4, 2007: Languages, mobility and migration, immigration and citizenship • January 15, 2008: Aboriginal peoples • March 4, 2008: Labour (including labour market activity, industry and occupation), place of work and commuting to work (including mode of transportation), education, language (including language of work) • April 2, 2008: Ethnic origin and visible minorities • May 1, 2008: Income and earnings, shelter costs