Download

1 / 1
10 likes | 150 Views
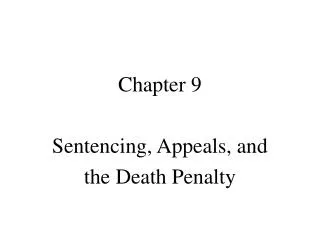
Figure 3. Death rates by age and sex: United States, 1955-2006. Male. Female. 40,000. 30,000. 85 years and over. 85 years and over. 20,000. 75-84 years. 10,000. 75-84 years. 65-74 years. 65-74 years. 55-64 years. Rate per 100,000 population. 1. Under 1 year. 1,000. 55-64 years.

E N D
Figure 3. Death rates by age and sex: United States, 1955-2006 Male Female 40,000 30,000 85 years and over 85 years and over 20,000 75-84 years 10,000 75-84 years 65-74 years 65-74 years 55-64 years Rate per 100,000 population 1 Under 1 year 1,000 55-64 years Under 1 year 1 45-54 years 45-54 years 35-44 years 35-44 years 25-34 years 15-24 years 25-34 years 100 1-4 years 15-24 years 5-14 years 5-14 years 1-4 years 10 1960 1960 1970 1980 1990 1970 1990 2000 2000 1980 1955 2006 1955 2006 1Death rates for “Under 1 year” (based on population estimates) differ from infant mortality rates (based on live births); see Figure 7 for infant mortality rates and “Technical Notes” for further discussion of the difference. SOURCE: CDC/NCHS, National Vital Statistics System, Mortality.