Download
1 / 5
50 likes | 291 Views
L 1-2 Making Bar Graphs. Objectives: You will learn to display and analyze data using bar graphs and line graphs. You will learn to compare numbers within the same graph. . Graphs are a useful way to organize information.

E N D
L 1-2Making Bar Graphs Objectives: You will learn to display and analyze data using bar graphs and line graphs. You will learn to compare numbers within the same graph.
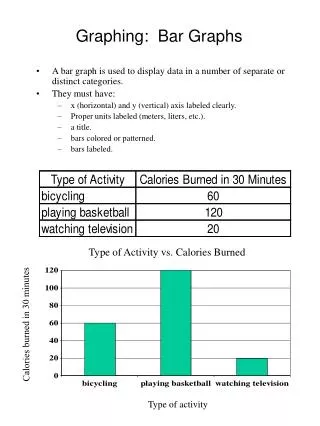
Graphsare a useful way to organize information. Dataare pieces of information that are often numerical and are often shown in a table or graph • A bar graph uses vertical and horizontal bars to display numerical information. The length of the bar tells you the number it represents. • The scale of a bar graph is the “ruler” in the vertical axis, that measures the heights of the bars. Ex. 0-10. • The interval is the amount of space between the values on the scale. Ex. intervals of 5 = 0, 5, 10, 15 etc. • The categories are written in the horizontal axis.
Analyzing a Bar GraphMake a bar graph showing our classes favorite ice cream flavor.Then compare the number of students who prefer chocolate to vanilla. Steps to make a bar graph: Step 1: Decide on a scale and the interval. Step 2: Label the horizontal and vertical axis. Step 3: Draw bars for each flavor of ice cream. The height of the bar shows the number of students who picked that flavor. Step 4: Label the graph with a title.
Answer the following questions. Review of Line Graphs 1. What is the title of this line graph? 2. How many points are in the graph? 3. What was the highest value recorded? 4. What was the lowest value recorded? 5. Did the value of the car increase or decrease over time?
Homework: Instructions: Use what you learned in lessons 1-1 and 1-2, to answer the following questions.