Download

1 / 6
60 likes | 157 Views
Explore how variance equality assumptions relate X and Y values in regression models. Calculate r^2 and r to determine relationships and significance. Learn interpretation and application in statistical analysis.

E N D
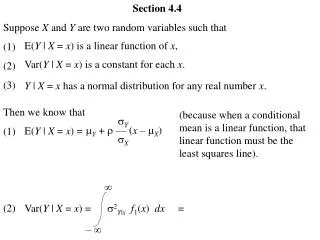
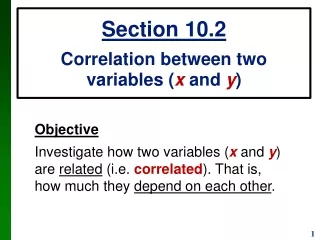
Let X and Y be two normally distributed random variables satisfying the equality of variance assumption both ways. For clarity let us examine this concept further. We assume that X is a normally distributed random variable (think bell curve). Pick any two distinct values of X, call them X1 and X2. The variance of the population of Y values that correspond to X1 must be equal to the variance of the population of Y values that correspond to X2. Likewise, we assume that Y is a normally distributed random variable (think bell curve again). If you pick any two distinct values of Y, call them Y1 and Y2, then the variance of the population of X values that correspond to Y1 must be equal to the variance of the population of X values that correspond to Y2.
1. Calculate the sample coefficient of determination (r2). This value (often expressed as a percentage) represents the proportion of the variation in Y that is attributable to the relationship expressed between X and Y in the regression model.
One Way to Calculate r2 What is the interpretation of the coefficient of determination (r2)? 92.89% of the variation in water consumption may be attributed to the linear relationship between the number of commercials and water consumption.
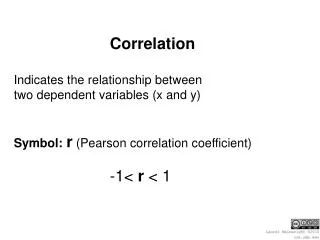
2. Calculate the sample correlation coefficient (r). with the sign of the cov(X&Y). REMEMBER: correlation coefficients are always between minus 1 and plus 1. Minus 1 is perfect negative correlation and plus 1 is perfect positive correlation.
3. To answer the QUESTION: "Does a linear relationship exist between X and Y at a certain level of significance?" we can use the test statistic: NOTE: Algebraically, this equation is exactly equal to the t-test used in regression analysis.
POINT: The sample correlation coefficient (the Pearson correlation coefficient) can be calculated directly using the formula: