Download
1 / 10
110 likes | 267 Views
EDMS nr° 1298911. CERN , 8th Jul 2013. Experimental measurement of CC winding-pack elastic properties : Complementary tensile tests on sections from top and bottom part of the 2 nd sample of the 3rd VPI mock-up. Dawid J. Marcinek, Lucia Lain, Aurore Ceyrolle supervisor: Stefano Sgobba

E N D
EDMS nr°1298911 CERN, 8thJul2013 Experimental measurement of CC winding-pack elastic properties: Complementarytensiletests on sections from top and bottom part of the 2ndsampleof the 3rd VPI mock-up Dawid J. Marcinek, Lucia Lain, Aurore Ceyrolle supervisor: Stefano Sgobba EN-MME-MM CERN
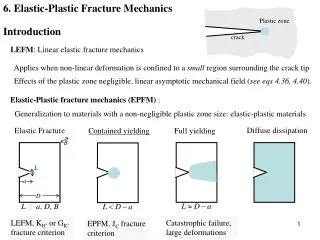
VPI mock-up 2nd sample 3rd mock-up Summary of previous tests • 2ndsample of the 3rd VPI mock-up: • 3D tomography by RX Solutions EDMS nr° 1258209 Results presented during the “CC sub-IPT Meeting” in Cadarache, Dec. 17-19, 2012 • 2ndsample of 3rd VPI mock-up: • Compression test EDMS nr° 1280238 Results presented during the “CC sub-IPT Meeting” in Cadarache, Apr. 16-18, 2012 2nd sample of the VPI Top • 2nd sample of the 3rdVPI mock-up • separated in parts: • Compression test of Top, Bottom • and Middle part • Max Force of 50kN and 180 kN • Compression with Zwick/Roell Z400 • Max force 400kN Zwick/Roell Compression test of 2nd VPI Middle Bottom EDMS nr° 1287211
Tensile tests • Tensile tests of Top and Bottom parts are performed in the direction along the conductors of the mock-up. • Aluminium EN-AW 6082 T6 (D40, 120 mm bar) tested as well for benchmarking. • Naming of the specimens as shown. • The thickness of Top and Bottom specimens is maintained and correspond to the thickness of top and bottom part (around 4.75 mm). Top Middle Bottom Alu1 Alu2 Alu3 Alu4 Alu5 Top1 Top2 Top3 Top4 Top5 Bott1 Bott2 Bott3 Bott4 Bott5
Tensile tests on Al-alloy EN-AW 6082 T6 • Tensile tests performed by UTS TestSysteme with 200kN load cell. • Extensometers are positioned on the gage length of 20 mm. • Conditions of the test are based on the standard method for tensile testing of metallic materials (ASTM-E8). • Test conditions for Al-alloy tests: • Test up to 300 MPawith a speed of 5 MPa/s and preload of 5 MPa Two EN-AW 6082 T6 specimens tested with an average elastic modulus (Eaverage) of 72 GPa
Tensile tests on resin Top and Bottom (1) • Tensile tests performed by UTS TestSysteme with 200kN load cell. • Extensometer is positioned on the gage length of 20 mm. • Conditions of the test are based on the standard method for tensile properties of Fiber-Resin composites (ASTM-D3039). • Test conditions for top and bottom tests: • Test up to 150 MPawith a speed of 0.25 mm/min • Preload of 5 MPa Top1 Top2 Top3 Top4 Top5 Bott1 Bott2 Bott3 Bott4 Bott5
Tensile tests of Top specimens The graph on the left shows examples of stress against strain curves. The graph on the bottom shows the part of unloading curve between 120 MPa and 40 MPa which is used to calculate the elastic modulus (difference is approx. +1 GPawrt modulus calculated in loading). * E calculated in loading, specimen used to assess general behaviour up to rupture ** E calculated in loading, specimen showing soft behaviour and prematurate rupture *** Average exclusively from moduli calculated during unloading ETop4 =11.5 Gpa ETop5=10.1 Gpa
Tensile tests of Bottom specimen The graph on the left shows examples of stress against strain curves. The graph on the bottom shows the part of unloading curve between 120 MPa and 40 MPa which is used to calculate the elastic modulus (difference is approx. +1 GPawrt modulus calculated in loading). EBott1 =11.2 GPa EBott5 =13.2 GPa All moduli calculated during unloading
Microscopical observation carried out on selected specimens brought to rupture Top1 Top1 E= 10.5 GPa Rm= 168 MPa All section reinforced E= 12.4 GPa E= 7.6 GPa Top3 Bott2 Rm= 199 MPa Rm= 144 MPa Approx. half section reinforced, soft behaviour, low modulus, early breakdown All section reinforced
Mechanical properties reinforced resin Micromechanical model: simple composite approach Transversal Load Longitudinal Load Elon/Em ETrans/Em + + K.K. Chawla, Composite Materials, Springer, 1998 For a 50 % volume fraction (Vf) of reinforcement (measured by us), the enhancement of the modulus in the fibre direction (Elon) is much more effective than perpendicular to the fibres (Etrans) relative to the modulus of the matrix (Em).
Tensile tests conclusions • Tensile elastic modulus is higher (10.7 GPa and 11.9 GPa for Top and Bottom, respectively) than compression modulus (4 GPa, see EDMS 1287211). This is explained by a simple composite model: modulus strongly depends on the direction of testing. • For a 50 % volume fraction of reinforcement, the enhancement of the modulus in the fibre direction is much more effective then perpendicular to the fibres. • Top part reinforcement shows locally soft behaviour (low modulus) and low strength for a specimen containing only partial volume reinforcement.