Download
1 / 18
180 likes | 186 Views
Learn about quadratic functions, graphing parent functions, vertical stretch and compression, vertical and horizontal translations, and vertex form.

E N D
QUADRATIC FUNCTIONS Translations & Transformations
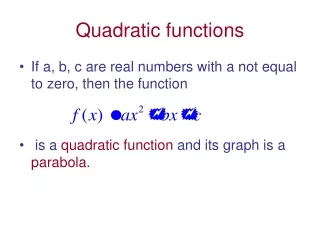
Identifying Parts of a Quadratic Function • A function that can be represented in the form of f(x) = ax2 + bx + c is called a quadratic function where a 0. The greatest exponent of the variable x is 2. The most basic quadratic function is f(x) = x2, which is the parent quadratic function. • The graph of a quadratic function is a curve called a parabola. • The point at which the parabola turns directions is called the vertex. • The vertical line that passed through the vertex and divides the parabola in half is called the axis of symmetry.
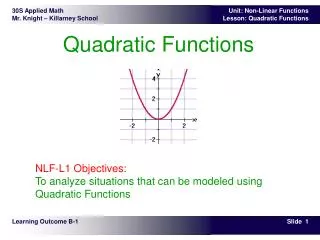
Graphing the Parent Quadratic Function f(x) = x2 • Create a table of values • The vertex of the parent function f(x) = x2 is (0,0) and the axis of symmetry is x = 0.
Graphing g(x) = ax2 when a > 0 • The graph of g(x) = ax2 is a vertical stretch or vertical compression of its parent function f(x) = x2. • When a > 1 the graph of g(x) is narrower than the parent function f(x) and there is a vertical stretch. • When 0 < a < 1 (which means a is a fraction) the graph of g(x) is wider than the parent function f(x) and there is a vertical compression. • When a > 0, the graph g(x) opens upward, and the function has a minimum value that occurs at the vertex of the parabola. • Domain – The domain of a quadratic function is all real numbers. • Range – The range of g(x) = ax2, where a > 0, is the set of all real numbers greater than or equal to the minimum value. The range is y > 0.
Graphing Vertical Stretch & Compression Parent Function Vertical Stretch Vertical Compression
Graphing g(x) = ax2 when a < 0 ( a is negative) • When a < 0 the graph g(x) opens downward, and the function has a maximum value that occurs at the vertex of the parabola. • The graph g(x) = -x2is a reflection of the graph f(x) = x2 in the x axis. • Domain – The domain of the quadratic function is still all real numbers. • Range – The range of g(x) = -ax2 is the set of real numbers less than or equal to the maximum value. The range is y < 0. • Graph the following quadratic functions. • g(x) = - 2x2 g(x) = - ½ x2
Transforming Quadratic Functions • Vertical Translations • A vertical translation of a quadratic function is a shift of the parabola up or down with no change in the shape of the parabola. • The graph of the function g(x) = x2 + k is the graph of f(x) = x2 translated vertically. • If k > 0, the graph of f(x) = x2 is translated k units up. • If K < 0, the graph of f(x) = x2 is translated k units down. • Graph each function and identify the minimum value, the range and axis of symmetry. • g(x) = x2 + 2 g(x) = x2 - 5
Transforming Quadratic Functions • Horizontal Translations • A horizontal translation of a quadratic function is a shift of the parabola left or right with no change in the shape of the parabola. • The graph of the function f(x – h)2 is the graph of f(x) = x2 translated horizontally. • If h > 0, the graph of f(x) = x2 is translated h units to the right. • If h < 0, the graph of f(x) = x2 is translated h units to the left. • Graph each function and identify the vertex and axis of symmetry. • g(x) = (x – 1)2 g(x) = (x + 3)2
Vertex Form of a Quadratic Functiong(x) = a(x – h)2 + k • The vertex form gives us a lot of information about the graph a quadratic function. • (h,k) is the vertex of the parabola • x = h is the axis of symmetry • k is the vertical shift of the parabola • h is the horizonal shift of the parabola • a is the vertical stretch or compression of the parabola. If a>0 the parabola is a “smile”(opens upward) and if a < 0, the parabola is a “frown” (opens downward and is a reflection in the x-axis). • If a > 0, the minimum value is k, and the range is y > k. • If a < 0, the maximum value is k, and the range is y < k.
Identify the vertex, axis of symmetry, the minimum or maximum value of the parabola and the range. Describe the transformation and graph the function. Example1: g(x) = -3(x + 1)2 – 2 Vertex: (-1, -2) Axis of Symmetry: x = -1 Maximum value: y = -2 Range: y < -2 This graph is a reflection of the parent function f(x) = x2 in the x-axis with a vertical stretch multiplied by a factor of 3 shifted two units downward and 1 unit to the left.
Creating the graph of the parabola using the vertex • Create a chart. Use the vertex as the middle point on the chart. • Find two points on each side of the vertex, and substitute the values in the function to get corresponding y values. • Graph the points.
Identify the vertex, axis of symmetry, the minimum or maximum value of the parabola and the range. Describe the transformation and graph the function. Example 2 - g(x) = 2(x – 1)2 – 7 Vertex: Description: Axis of Symmetry: Minimum Value: Range: Practice Problems g(x) = -(x – 2)2 + 4 g(x) = 2(x + 3)2 - 1
Standard Form of a Quadratic Functionf(x) = ax2 + bx + c • The standard form of a quadratic equation is y = ax2 + bx + c. We can use the standard form to find the x-value of the vertex (the axis of symmetry) by using the equation x = -b/2a. The y value of the vertex can be found by substituting the x-value back into the original equation. • Find the axis of symmetry and the vertex of the following quadratic equation. • y = 3x2 + 6x + 11 y = 3(-1)2 + 6(-1) + 11 • x = -6/2(3) y = 3 - 6 + 11 • x = -1 y = 8 • The axis of symmetry is x = -1 and the vertex is (-1,8)
Let’s Practice ! • Find the axis of symmetry and the vertex for the equation below. • Example 1: y = -2x2 + 12x - 16 • Find the axis of symmetry and the vertex for the equation below. • Example 2: y = 2x2 + 2x - 4
Changing Vertex Form to Standard Formy = a(x – h)2 + k to y = ax2 + bx + c • Example 1: y = 4(x – 6)2 + 3 • y = 4(x – 6)(x – 6) + 3 • y = 4(x2 – 12x + 36) + 3 • y = 4x2 – 48x + 144 + 3 • y = 4x2 – 48x + 147 • Standard form is y = 4x2 – 48x + 147 • Practice Problem • y = 2(x + 5) + 3 • Complete pg. 725 #12 - 17 • Example 2: y = -3(x + 2)2 – 1 • y = -3(x + 2)(x + 2) – 1 • y = -3(x2 + 4x + 4) – 1 • y = -3x2 – 12x – 12 – 1 • y = -3x2 -12x – 13 • Standard form is y = - 3x2 – 12x – 13 • Practice Problem • y= -3(x – 7)2 + 2
Writing a Quadratic Equation in Standard form from a Table • Step 1: Use the vertex in the table to write the quadratic equation in vertex form. • Vertex • Vertex Form: y = a(x –(-3))2 • Vertex Form is y = a(x + 3)2
Step 2: Substitute a point from the table for x and y in the vertex form to find a. y = a(x + 3)2 1 = a( -2 +3 )2 1 = a Vertex Form: y = (x + 3)2 y = (x + 3)(x + 3) Standard Form: y = x2 + 6x + 9
Use the tables below to write the quadratic equations in standard form. 1. 2.