
Figure- 1
Piraye Yaras PhD Thesis, 1996. Figure- 1. h * =26 Pa.s. Binder Phase is a Newtonian Silicone Fluid Constant Magnitude of Complex Viscosity. Figure- 2. h =26.2 Pa.s. The shear viscosity and magnitude of complex viscosity are the same. Figure- 3.
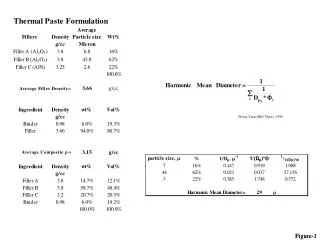

Figure- 1
E N D
Presentation Transcript
Piraye Yaras PhD Thesis, 1996 Figure-1
h*=26 Pa.s Binder Phase is a Newtonian Silicone Fluid Constant Magnitude of Complex Viscosity Figure-2
h=26.2 Pa.s The shear viscosity and magnitude of complex viscosity are the same Figure-3
Data collected using two different capillary die diameters (D=0.0985 and 0.0675 in”) with two different L/Ds Figure-4
Surface Quality of Extruded Samples (D=0.0985, L/D=45) This sample is extruded at 0.05 in/min and has a rough surface This sample is extruded at 0.5 in/min This sample is extruded at high crosshead speed (1 in/min) and it has smooth surface Figure-5
Extruded at 0.05 in/min and has a rough surface Extruded at high crosshead speed (1 in/min) and it has smooth surface Figure-6
Entrance Bagley Correction Figure-7
( ) ¶ g τ = & 8 U s ¶ ( 1 / D ) t w w Figure-11
Power low exponent of Us versus tw curve is close to 1 which is the case for a Newtonian binder Figure-12
Qs/Q values are close to 1 at low shear stresses and decrease with increasing shear stress Figure-13
Hershel Bulkley Fit- A t=4300+22144g0.616 Hershel Bulkley Fit- B t=1400+25979g0.546 Figure-14
Calculated apparent slip layer thickness,d, from experimental data and compared with theoretical equation given below [Kalyon, J. Rheol., 49(3),621-640 (2005)] Figure-17
Comparison of materials of construction – Al vs. Stainless steal capillary dies Figure-18
Squeeze Flow, D=2.25 in Figure-19
30000 cst Binder Thermal Paste Frequency sweep @ 0.01% strain Figure-22
Comparison of storage modulus of thermal pastes with two different binder – 30 000cst and 1000 cst
Comparison of time sweep data @ 0.01% strain with different frequency values
Strain sweep @ 5 rps Figure-26
Strain sweep @ 10 rps Figure-27
Bergquist 1K cst, temperature dependence of the magnitude of complex viscosity
Bergquist 30K cst, temperature dependence of the magnitude of complex viscosity
Sinusoidal torque response during frequency sweep @ 0.01% Figure-35


