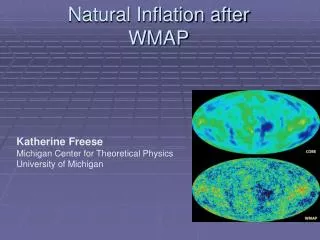
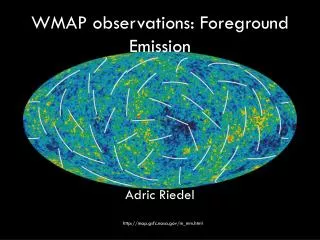
WMAP observations: Foreground Emission
Adric Riedel. WMAP observations: Foreground Emission. http://map.gsfc.nasa.gov/m_mm.html. Overview. What it is The Cosmic Background Removing the foreground Sources of Contamination Free-Free emission Synchrotron emission Thermal Dust emission Spinning/Magnetic Dust emission

WMAP observations: Foreground Emission
E N D
Presentation Transcript
Adric Riedel WMAP observations: Foreground Emission http://map.gsfc.nasa.gov/m_mm.html
Overview • What it is • The Cosmic Background • Removing the foreground • Sources of Contamination • Free-Free emission • Synchrotron emission • Thermal Dust emission • Spinning/Magnetic Dust emission • Extragalactic sources • Sunyaev-Zeldovich effect
What it is W ilkinson M icrowave A nisotropy P robe • Designed to measure minute CMB variations • Follow up to COBE • Launched 2001 • Located at the L2 Lagrange Point • Still in operation http://map.gsfc.nasa.gov/m_ig/990293/990293.html
The Cosmic Microwave Background • Predicted by Gamow as a consequence of the Big Bang theory • Predicted to be observable by Dicke • Discovered accidentally by Penzias & Wilson at Bell Labs in 1965 • Isotropic (so they thought) • Non-polarized (so they thought) • Constant (non-seasonal) • Traces a blackbody curve (Weymann, 1967) http://www.smecc.org/microwave_oven.htm
COBE • The Big Bang model predicted the CMB should notbe isotropic • The COBE satellite was the first to measure the anisotropy of the CMB (variations of 10-5 out of 2.725 K) http://lambda.gsfc.nasa.gov/product/cobe/cobe_images/cmb_fluctuations_big.gif
How the CMB is observed • WMAP is outfitted with sensors for a variety of frequencies: 23, 33, 41, 61, 94 Ghz • The CMB dominates all other emission between 30-150 GHz • Other spacecraft (including COBE) have made detailed maps of the sky at various relevant frequencies • Use other data sets to find the extent of contamination http://www.bu.edu/iar/images/Hinshaw.ppt
Removing the foreground • The Cosmic Microwave background is in the background, hidden behind everything else in the universe. • To get the CMB, the foreground must be removed. Masks based on K-band (23 GHz)
A note on notation • All the spectra are characterized as power law spectra TA~υβ , and TA is the antenna temperature. • Spectra also characterized by flux S~υ where we assume β=-2 • So, for a given wavelength υ and varying fluxes S, we can convert flux to temperature given the value of β(or ) • The intent is to separate out just the CMB around T=2.725 K by filtering out the microwave emissions of other processes
Sources of Contamination: Earth • Cars, antennas, radios • WMAP is situated at Earth’s L2 point, thus removing it from Earthbound interference http://antwrp.gsfc.nasa.gov/apod/ap050102.html http://map.gsfc.nasa.gov/m_mm/ms_status2.html
Sources of Contamination: Galactic • Four major processes: • Free-Free emission • Synchrotron Emission • Thermal emission • Spinning dust (Magnetic)
Sources of Contamination: Galactic • Free-Free emission • TA~υβ where β=-2.15 for Microwave frequencies (S~υ-0.15) • Found in hydrogen clouds. • Not mapped in radio waves- emission is not dominant at any radio frequency γ
Sources of Contamination: Galactic • Free-Free emission • Fortunately, H has been mapped • H corresponds to the same thing (Hydrogen) • Not a perfect correspondence especially due to dust, helium presence, rates...
Sources of Contamination: Galactic • Synchrotron Emission • Produced by acceleration of electrons to cosmic ray levels. (Type Ib and II supernovae) • Found: SNR, diffuse • Propagate via scattering off random B fields (diffusion) or systematic motion (convection) • Diffuse component more common than SNR (90%) • SNR component more powerful due to B fields http://heritage.stsci.edu/2000/20/big.html
Sources of Contamination: Galactic • Synchrotron Emission • Various ways for cosmic rays to lose energy- Synchrotron emission, inverse Compton scattering, adiabatic loss, free-free loss. • Most cosmic rays do not leave the galaxy, especially the most powerful- they lose energy faster.
Sources of Contamination: Galactic • Synchrotron Emission • N(E)~E-γ, flux density =-(γ-1)/2 • γ (and )vary greatly; the resulting flux is very frequency-dependent • For the CMB frequencies, β=-2.6 (plane) to -3.1 (halo); average is -2.7. This is common. The sky at 408 MhZ (Synchrotron Emission )
Sources of Contamination: Galactic • Thermal Dust • Characteristic dust emission has been mapped in IR (IRAS, COBE) and representative temperatures • Seems to be correlated with the synchrotron emission; probably due to the fact that both are centred around star-forming regions.
Sources of Contamination: Galactic • Thermal Dust • β is generally 1.5 to 2; below 20 K the slope is between 1.6 and 2.5 W band (94 GHz)
Sources of Contamination: Galactic • Magnetic Dust • Electric dipole emission from spinning dust • Magnetic dipole emission from thermally fluctuating dust. • β~-2 • Though predicted, there doesn’t seem to be very much- out of 10 examined (Finkbeiner et al. 2002), 2 ‘tentative’ detections, 8 failures.
Results from other galaxies • Klein & Emerson (1981) and a few others report that the power spectra of galaxies is synchrotron & free-free only. • Few observations have been carried out above 10 GHz, where spinning dust is predicted to become apparent
Sources of Contamination: Extragalactic • Point sources • The galactic removal methods generally clean up extragalactic sources as well • Use galaxy catalogue of sources observed at Radio and Microwave frequencies where the CMB doesn’t dominate • 208 sources were removed, statistically five are spurious
Sources of Contamination: Extragalactic • Sunyaev-Zeldovich Effect • Hot Gas excites CMB photons, shifting the peak but not increasing the amplitude to match, effectively making the CMB look cooler. (http://www.mpifr-bonn.mpg.de/staff/mthierbach/sz.html) • Most prominently due to the gas in the Coma Cluster • Removed like the point sources http://www.mpifr-bonn.mpg.de/staff/mthierbach/sz.html
WMAP mapping • Combine the five frequencies linearly, properly scaled so that the foreground cancels itself out and leaves only the background • Model the absorption by combining properly-scaled maps of the particular emission contaminants, and subtract
WMAP map error Result http://www.bu.edu/iar/ images/Hinshaw.ppt Error • Note that the maximum difference 70 μK (errors confined to 5 μK, the CMB anisotropy is on the order of 200 μK)
Works Cited • Bennett, C.L. et al. 2003, ApJS, 148, 97 • Hinshaw,G. 2003, 5th Boston University Astrophysical Conference notes. • Weymann, R.J. 1967, ASPL, 10, 81 • Theirbach, M. “Sunyaev-Zeldovich Effect” 1997, http://www.mpifr-bonn.mpg.de/staff/mthierbach/sz.html. January 28, 1997. September 27, 2006. http://www.bu.edu/iar/images/Hinshaw.ppt