Download

1 / 22
220 likes | 376 Views
Identifying landslide triggers and estimating inundation zones in the Monte Sano Nature Preserve. Applications of Spatial Analysis tools and ArcInfo Workstation software. ATS 515 – Advanced Topics in GIS Robert Griffin, Instructor 28 February 2012. Eric R. Anderson

E N D
Identifying landslide triggers and estimating inundation zones in the Monte Sano Nature Preserve Applications of Spatial Analysis tools and ArcInfo Workstation software ATS 515 – Advanced Topics in GIS Robert Griffin, Instructor 28 February 2012 Eric R. Anderson University of Alabama in Huntsville Department of Atmospheric Science
Lesson Outline • Overall goals and specific objectives • Context and important concepts • Pinpoint landslide triggers • Simulate rock avalanche inundation zones • Visualize results (time permitting) • Discuss the methods and results
Overall goals and specific objectives • Pinpoint locations most prone to slope failure • Delineate rock fall inundation hazard zones • Perform basic surface and hydrology analyses of high resolution digital terrain model (DTM) • Predict the locations of unstable conditions as a function of slope and upslope contributing area • Simulate rock avalanches to estimate inundation hazard areas • (time permitting) Visualize results in ArcScene.
Context and important concepts • Annual losses attributed to landslides are greater than any other natural disaster except hurricanes (Lee 2009) • $3 billion + annually in the US (USGS 2006) • $10 billion + annually worldwide (Lee 2009) • Where they happen • Types of landslides
Landslide potential in the U.S. Red – very high Yellow – high green – moderate (Abbott 2012)
Classification of Mass Movements • Speed and water content (Abbott 2012) Insert Table 15.2
Classification of Mass Movements • Downward – falling or subsiding • Downward and outward – sliding and flowing (Abbott 2012)
Falls • Elevated rock mass separates along joint, bedding or weakness and falls downward through air in free fall until hitting the ground, bouncing and rolling • Yosemite National Park, California, 1996 • 162,000 ton granite mass slid and launched into air, fell 500 m before hitting valley floor • Blast knocked down 1,000 trees • 50 acres covered with inch-thick layer of dust • One person killed by tree (Abbott 2012)
Flows • La Conchita, CA, Slump, Debris Flows, 1995, 2005 • Cliff behind La Conchita is ancient landslide • 1995: two slow landslides destroyed 14 houses, no deaths • 2005: 15% of 1995 slide mass remobilized into highly fluid debris flow, at 10 m/sec, went over retaining wall, destroyed 13 houses, damaged 23 others, killed 10 people (Abbott 2012) 2005 1995
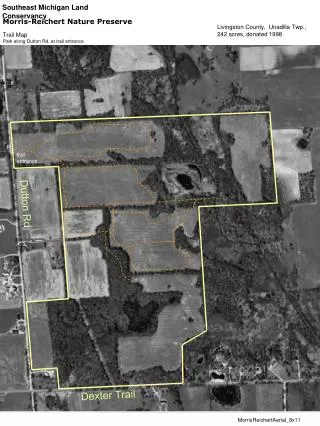
Landslide Susceptibility in Alabama (extract of Madison County) Moderate to Very High susceptibility throughout Monte Sano State Park and the Land Trust By: Sandy M. Ebersole, Steven Driskell and Anthony M. Tavis. Geologic Mapping and Hazards Section, Geological Survey of Alabama, December 2011.
Landslide triggers • Converging upslope contributing areas • Failure slope threshold • Regions of continuous steep slopes (Montgomery and Dietrich 1994; Dietrich et al 1998; in Griswold 2012)
Inundation hazard zones • LAHARZ software • For a given volume, V, Objectively delineates hazard zones based on elevation • Cross-sectional inundation area, A • Planimetric inundation area, B • Iverson et al 1998
Inundation hazard zones • (Iverson, USGS)
Exercises • Part I – identify trigger cells in ArcGIS Desktop • Part II – delineate hazard zones using LAHARZ in Arc Workstation
Field observations • Environment of trigger points • Evidence of past landslides • Evidence of slumping
Visualize the results • Open the following in ArcScene: • Original DEM • Hillshade • Triggers shapefile • LAHARZ outputs • For all layers, set Base Heights to DEM • Right click on layer/Properties/Base Heights/ Floating on Custom Surface
Discussion • What were our inputs for a) trigger and b) inundation estimates? • What are the assumptions? • What are the uncertainties, and how do we deal with these? • How can we improve these models?
Acknowledgements • Julia Griswold, Steve Schilling, Jon Major, USGS • Sundar Christopher, Robert Griffin, Tom Sever, Kevin Knupp, Stephanie Mullins, Africa Flores, UAHuntsville • Daniel Irwin, Jason Kessler, Gwen Artis, Ashutosh Limaye, Francisco Delgado, Burgess Howell, KarthikSrinivasan, NASA/SERVIR • Carrie Stokes, Michelle Jennings, Orlando Altamirano, Ruben Aleman, USAID • Emilio Sempris, Emil Cherrington, Antonio Clemente, Alejandro del Castillo, CATHALAC • Manuel Diaz, Giovanni Tobar, Karla Marroquín, Luis Mixco, SNET/MARN (El Salvador)