Download
1 / 25
250 likes | 364 Views
The Stroke Policy Model (SPM) is designed to enhance decision-making in stroke treatment by providing a systematic approach to decision analysis. Developed by a team of experts including David Matchar and Greg Samsa, the SPM helps in clarifying and simplifying complex decisions by integrating comprehensive data and facilitating "what-if" analyses. While modeling offers significant benefits, such as long-term extrapolation of outcomes, it is accompanied by challenges like the risk of mis-specification and difficulties in interpreting outputs. This paper discusses the rationale for modeling, advantages, and disadvantages, and outlines the SPM's application within randomized trials for effective stroke management.

E N D
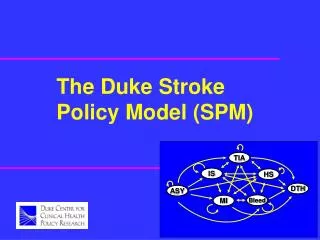
TIA IS HS DTH ASY Bleed MI The Duke Stroke Policy Model (SPM)
Developers • David Matchar, MD -- principal investigator • Greg Samsa, PhD -- project director, statistician • Giovanni Parmigiani, PhD -- statistician, software developer • Joe Lipscomb, PhD -- health economist • Greg Hagerty, MS -- software developer
Outline • Rationale for modeling (*) • SPM described • Applying the SPM to a randomized trial • Extensions
Rationale for modeling • Why model? • Arguments for modeling • Arguments against modeling • Discussion • Conclusions • Application to stroke
Why model? (cont’d) • “To me, decision analysis is just the systematic articulation of common sense: Any decent doctor reflects on alternatives, is aware of uncertainties, modifies judgements on the basis of accumulated evidence, balances risks of various kinds, . . .”
Why model? (cont’d) • “ considers the potential consequences of his or her diagnoses and treatments, and synthesizes all of this in making a reasoned decision that he or she decrees right for the patient…” • (cont’d)
Why model? • “… All that decision analysis is asking the doctor to do is to do this a lot more systematically and in such a way that others can see what is going on and can contribute to the decision process.” -- Howard Raiffa, 1980
Advantages of modeling • Clarifies decision-making • Simplifies decision-making • Provides comprehensive framework • Allows best data to be applied • Extrapolates short-term observations into long-term • Encourages “what if” analyses
Disadvantages of modeling • Ignores subjective nuances of patient-level decision-making • Problem may be incorrectly specified • Inputs may be incorrect / imprecise • Usual outputs are difficult to interpret or irrelevant to decision-makers
Individual decision-making is subjective • For individual decision-making, primary benefit of modeling is clarification. • As normative process, decision-making works better for groups. • Most applications involve group-, rather than individual-level, decisions (e.g., CEA, purchasing decisions, guidelines).
An aside • Interactive software (possibly including models) shows great potential to help decision-makers (e.g., patients, physicians, pharmacy benefits managers) clarify and make better decisions. • We are developing prototype for a “user-friendly version” of the SPM.
Some models are mis-specified • A good model will simplify without over-simplifying. • Poor models exist, but this need not imply that modeling itself is bad. • We need more explicit standards under which models are developed, presented, and assessed.
An observation • The fundamental problem with many of the poor models in circulation is that they assume the answer they are purporting to prove • (often, that a treatment which is trivially effective or even ineffective is nevertheless cost-effective). • Users are understandably wary.
Model inputs may be incorrect/ imprecise • This problem is often most acute for utilities and costs, and least acute for natural history and efficacy. • We need more and better data on cost and quality of life. • The less certain the parameter, the greater the need for sensitivity analysis.
An aside • In practice, the conclusions of a model / CEA are never stronger than the strength of the evidence regarding efficacy. • If the evidence about efficacy is weak, then modeling / CEA should not be performed.
Usual outputs are difficult to interpret • In academic circles, results are presented as ICERs using the societal perspective. • Present this as a base case for purposes of publication / benchmarking. • Also present multiple outcomes from multiple perspectives (vary cost categories, vary time periods, present survival, event-free survival, QALY, …).
General conclusions • Modeling is of great potential benefit and indeed is sometimes the only reasonable way to proceed. However, models must be held to a high standard of proof. • Although the standard reference model cannot be ignored, modeling should be done flexibly, with the needs of the end user in mind.
Application to acute stroke treatment • RCTs follow patients in the short-term, but the large majority of benefits accrue in the long-term. • Simple heuristics will not suffice to adequately trade off complex risks, benefits, and costs. • Modeling allows a large body of evidence to be efficiently synthesized.
Outline • Rationale for modeling • Stroke model described (*) • Applying the SPM to a randomized trial • Extensions
SPM described • History / background • Types of analysis • Structure • Validation / citations
SPM development (cont’d) • First version developed in 1993 by Stroke PORT • Goals of stroke PORT: • Summarize epidemiology of stroke • Describe best stroke prevention practices • Describe current practices, and test methods for improving practice
SPM development • SPM was used: • To summarize epidemiology of stroke • To support CEA • As a basic organizing structure for the PORT
SPM versions • Original C++ code (uses waiting time distributions, research tool, difficult to extend) • New S+ code (uses waiting time distributions, highly structured code used as development tool, inefficient) • New C++/Decision-Maker code(uses Markov-based cycles, intervention language, better interface, extendable)
New C++ version • Decision-Maker used to specify natural history and effect of interventions in a decision tree format • Efficient C++ code used as simulation engine • Expandable into a web-based tool