Download
1 / 44
440 likes | 463 Views
A core project of. SPARC - Stratospheric Network for the Assessment of Predictability (SPARC-SNAP). SPARC-SNAP Team

E N D
A core project of SPARC - Stratospheric Network for the Assessment of Predictability (SPARC-SNAP) SPARC-SNAP Team Om P Tripathi, Andrew Charlton-Perez, Greg Roff, Mark Baldwin, Martin Charron, Stephen Eckermann, Edwin Gerber, David Jackson, Yuhji Kuroda, Andrea Lang, Ryo Mizuta, Michael Sigmond, Seok-Woo Son
Important Potential sources of sub-seasonal (15-60 days) predictability (S2S Implementation plan) • Madden Julian Oscillation (MJO) • Stratospheric conditions • Land/Ice/Snow initial condition • Sea-surface temperature
Important Potential sources of sub-seasonal (15-60 days) predictability (S2S Implementation plan) • Madden Julian Oscillation (MJO) • Stratospheric conditions • Land/Ice/Snow initial condition • Sea-surface temperature
Important Potential sources of sub-seasonal (15-60 days) predictability (S2S Implementation plan) • Madden Julian Oscillation (MJO) • Stratospheric initial condition • Land/Ice/Snow initial condition • Sea-surface temperature Processes that impact sub-seasonal skill are not well understood Predictable skill might be higher in some Window of Opportunity Recognising these window of opportunity is still unclear
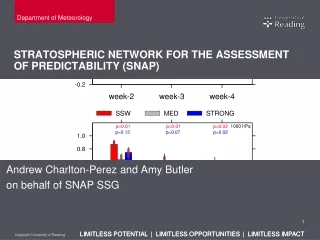
Stratospheric Impact at sub-seasonal scale • S2S recognise that the importance of the stratosphere has not been fully assessed • Case studies has shown that the stratosphere influence on the extra-tropics • Stratosphere impact NAO and SAM during extreme vortex events such as SSW • UK Met Office already runs with well resolved stratosphere and uses Window of Opportunity to re-run the sub-seasonal forecast • For example Met Office predicted SSW 2013 15 days in advance and corrected (re-run) their sub-seasonal forecast for Europe
S2S and Stratosphere • WCRP-CLIVAR Working group recognise its important and working on to quantify the improvement in forecast skill via its Stratospheric resolving Historical Forecast Project (SHFP) by employing better resolved stratosphere • S2S encourages active Collaboration between SHFP and sub-seasonal forecast groups • SPARC-SNAP’s focus is on the direct contribution at sub-seasonal scale by understanding the stratospheric predictability itself and its contribution to sub-seasonal forecast e.g. exploiting Windows of Opportunity • S2S plan to archive variables in the stratosphere but the highest level is only 10 hPa • SPARC-SNAP archives full stratosphere till 1 hPa with models having high vertical resolution in the stratosphere
Stratospheric Network for the Assessment of Predictability (SNAP) SNAP Introduction
SPARC – SNAP A network of research and operational communities aims to answer following fundamental questions: • Are stratosphere-troposphere coupling effects important throughout the winter season or only when major stratospheric dynamical events occur? • How far in advance can major stratospheric dynamical events be predicted and usefully add skill to tropospheric forecasts? • Which stratospheric processes, both resolved and unresolved need to be captured by models to gain optimal stratospheric predictability?
Steering Committee • Mark Baldwin University of Exeter, UK • Martin CharronEnvironment Canada, Canada • Steve EckermannNRL, USA • Edwin Gerber New York University, USA • Yuhji Kuroda Japan Met Agency, Japan • David Jackson Met Office, UK • Andrea Lang University at Albany, USA • Greg RoffBureau of Meteorology, Australia • Seok-Woo SonSeoul National University, S Korea • Om Tripathi University of Reading (Co-ordinator) • Andrew Charlton-Perez University of Reading (PI)
SNAP Activities • A new multi-model experiment to quantify stratospheric predictability • Stimulate the growth of a community of researchers interested in stratospheric predictability (workshop, web, newsletters etc). • A review paper on current understanding of stratospheric predictability (under review) • A SPARC report and peer-reviewed articles on the findings of the experiment.
SPARC-SNAP Operational Models and Database • Environmental Canada (EC), CANADA • Met Office, UK • Meteorological Research Institute (MRI), JAPAN • Naval Research Laboratory, USA (NAVGEM) • Bureau of Meteorology, Australia (CAWCR) • Korea Meteorological Administration (KMA), Korea • Korea Air Force operational model, Korea Polar Research Institute, Korea (KOPRI) • BADC is hosting SNAP experimental data • Data is accessible on request at http://badc.nerc.ac.uk/help/jasmin_workspaces.html • For info about SPARC-SNAP activity and data access: http://www.met.reading.ac.uk/~pn904784/snap/
Stratospheric Sudden Warming NH SSW of 2012-2013 Time line of how it happened ?
How it happened 10 hPa Geopotential Height Zonal mean wind (U) at 10 hPa (60 N) 22 December vortex was slight off-pole over Northern Russia 31 December its size reduced drastically and moved towards pole 05 January elongated over Northern Canada to Northern Russia Wind Reversed at 1 hPa 07 January broke into two pieces, larger one over Canada and smaller over Russia
CAWCR Predictability 4. ZONAL MEAN ZONAL WIND How Basic State (vertical wind configuration) differ during the start of vortex weakening in 15 days and 10 days forecast and 15 days forecast failed ?
31 DECEMBER ERAI 08 days Forecast: 23 Dec 04 days Forecast: 28 Dec
01 JANUARY ERAI 09 days Forecast: 23 Dec 05 days Forecast: 28 Dec
02 JANUARY ERAI 10 days Forecast: 23 Dec 06 days Forecast: 28 Dec
03 JANUARY ERAI 11 days Forecast: 23 Dec 07 days Forecast: 28 Dec
04 JANUARY ERAI 12 days Forecast: 23 Dec 08 days Forecast: 28 Dec
05 JANUARY ERAI 13 days Forecast: 23 Dec 09 days Forecast: 28 Dec
06 JANUARY ERAI 14 days Forecast: 23 Dec 10 days Forecast: 28 Dec
CAWCR Predictability Stratosphere and Troposphere predictability How tropospheric forecast of 500 hPa polar cap (60-90 N) Mean Geopotential height differ in 15 day forecast and other forecasts ?
U at 10hPa 60 N Polar cap Geopotential Height at 500 hPa
INITIAL PHASE - 1 23 DECEMBER U at 10hPa 60 N Polar cap Geopotential Height at 500 hPa -15 days Forecast: Strong ensemble spread in one side for tropospheric forecast after about 4 days
INITIAL PHASE - 1 23 DECEMBER U at 10hPa 60 N Polar cap Geopotential Height at 500 hPa -15 days Forecast: Strong ensemble spread in one side for tropospheric forecast after about 4 days Ensemble mean tropospheric forecast lost track after 4 days
INITIAL PHASE - 2 28 DECEMBER U at 10hPa 60 N Polar cap Geopotential Height at 500 hPa -10 days Forecast: Ensemble spread for tropospheric forecast lies both side
INITIAL PHASE - 2 28 DECEMBER U at 10hPa 60 N Polar cap Geopotential Height at 500 hPa -10 days Forecast: Ensemble spread for tropospheric forecast lies both side AND Ensemble mean tropospheric predictability is more skilful than 15 days forecast
SSW PHASE -1 02 JANUARY U at 10hPa 60 N Polar cap Geopotential Height at 500 hPa -5 days Forecast: Here also spread is both sided particularly after 5 days in comparison to 15 days forecast
SSW PHASE -1 02 JANUARY U at 10hPa 60 N Polar cap Geopotential Height at 500 hPa -5 days Forecast: Here also spread is both sided particularly after 5 days in comparison to 15 days forecast AND ensemble mean better represents the tropospheric state
SSW PHASE -2 07 JANUARY U at 10hPa 60 N Polar cap Geopotential Height at 500 hPa 0 days Forecast: Spread is similar to the 10 days and 5 days forecast
SSW PHASE -2 07 JANUARY U at 10hPa 60 N Polar cap Geopotential Height at 500 hPa 0 days Forecast: Spread is similar to the 10 days and 5 days forecast AND tropospheric predictability has similar skill to the last two
RECOVERY PHASE 12 JANUARY U at 10hPa 60 N Polar cap Geopotential Height at 500 hPa +5 days Forecast: Similar spread here
RECOVERY PHASE 12 JANUARY U at 10hPa 60 N Polar cap Geopotential Height at 500 hPa +5 days Forecast: Similar spread here AND similar tropospheric skill for up to 12 days
Models Comparison 1. CAWCR - 24 member ensemble mean 2. JMA - 51 member ensemble mean 3. Korea Polar Research Institute (KOPRI) – GRIMs_V3.2 -3 member (single run initialized by NOAA GDAS1 with model top at 3 hPa on the day, one day before, and one day after)
Summary – S2S and SNAP • SNAP is a network to understand stratospheric predictability and its impact on tropospheric forecast may be able to contribute in the S2S RESEARCH ISSUES • SNAP Researchers can use S2S archived data to complement the SNAP experimental data to further the understanding of the key processes • Many of the S2S models are also part of SNAP making it easier for attribution studies. • Research communities are welcome to participate in the Stratospheric Predictability Study • SNAP group are keen in the Active and Engaged collaboration with S2S
Summary • SNAP aims to look for stratospheric predictability and its impact on tropospheric forecast • First results of SNAP activities are presented • 10 day forecast from Australian Operational forecast model has shown a reasonably good predictive skill • 15 day forecast, however, failed to predict the SSW • The reason appears to be the lack of wave amplification during pre-stage of SSW in 15 day forecast • Once the Stratospheric Sudden Warming happens the model has shown to have very good predictive skill up to 15 days during recovery phase • It appears that when model fails to predict the stratosphere in case of the forecast run of 23 December, the tropospheric predictive skill is poorest • Fore other forecasts, when the model was able to predict the stratosphere well the tropospheric forecast appeared more skilful • CAWCR appears to have slightly more skill in SSW prediction • You are welcome to participate in the Stratospheric Predictability Study • Active and Engaged collaboration with S2S communities
THANK YOU QUESTIONS ?