Figure 1
70 likes | 205 Views
Figure 1. Pressure-Volume curves. Contraction. Volume. Dilation. Decreasing A. 0. 0. Transmural Pressure. Figure 2. Pressure-Volume curve. Pressure-Volume curve. Contraction. Dilation. Volume. Volume. Steady-state P-V curve. Steady-state P-V curve. 0. 0. 0. 0.

Figure 1
E N D
Presentation Transcript
Pressure-Volume curves Contraction Volume Dilation Decreasing A 0 0 Transmural Pressure Figure 2
Pressure-Volume curve Pressure-Volume curve Contraction Dilation Volume Volume Steady-state P-V curve Steady-state P-V curve 0 0 0 0 Transmural Pressure Transmural Pressure (b) (a) Figure 3
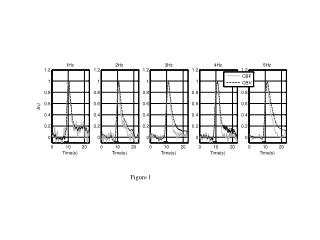
1Hz 2Hz 1.02 1.03 1.02 1.01 normalised CBV 1.01 1 1 0.99 0.99 0 5 10 15 20 0 5 10 15 20 4Hz 3Hz 1.04 1.02 1.02 1.01 normalised CBV 1 1 0.99 0 5 10 15 20 0 5 10 15 20 Time(s) 5Hz 1.06 CBV data 1.04 normalised CBV VW pred 1.02 EW pred 1 0 5 10 15 20 Time(s) Figure 4
(a) (b) (c) (d) (e) (f) Figure 5
subj 2, 4Hz subj 1, 4Hz 1.04 1.04 normalised CBV 1.02 1.02 1 1 0 5 10 15 20 0 5 10 15 20 subj 3, 4Hz subj 5, 4Hz CBV data 1.02 1.06 VW pred 1.015 EW pred 1.04 1.01 normalised CBV 1.005 1.02 1 1 0.995 0 5 10 15 20 0 5 10 15 20 Time(s) Time(s) Figure 6
1.4 sim CBF sim CBV 1.35 sim Pressure 1.3 1.25 Normlaised Unit 1.2 1.15 1.1 1.05 1 0 2 4 6 8 10 12 14 16 18 20 Time(s) Figure 7


