Neural Networks in ECG classification
620 likes | 1.17k Views
Neural Networks in ECG classification. Under the guidance of Prof. P. Bhattacharya Nishant Chandra Mrigen Negi Meru A Patil. Layout. History of Neural networks in medical Need for accurate processing Applications of ANN in medical What is ECG?

Neural Networks in ECG classification
E N D
Presentation Transcript
Neural Networks in ECG classification Under the guidance of Prof. P. Bhattacharya Nishant Chandra Mrigen Negi Meru A Patil
Layout • History of Neural networks in medical • Need for accurate processing • Applications of ANN in medical • What is ECG? • ANN in classification of Arrhythmias and Ischemia • Conclusion
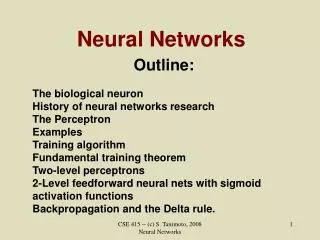
History of Neural Networks in Medical • Pioneering work of neural network has started since 1943 by McCulloch and Pitts. • Pattern recognition problem was introduced by Rosenblatt (1958)
Need for accurate processing • One of the major goals of observational studies in medicine is to identify patterns in complex data sets. • Correct classification of heart beats is fundamental to ECG monitoring systems such as an intensive care etc. • Computers are used to automate signal processing. • ANNs can detect patterns and make distinctions between different patterns that may not be apparent to human analysis.
Applications of ANN in medical • It has been successfully applied to various areas of medicine to solve non-linear problems. • Applications include prediction of diagnosis such as: • Cancer • the onset of diabetes mellitus • survival prediction in AIDS • eating disorders etc • Applications in signal processing and interpretation involve ECGs or electrocardiograms
Motivation • Cardiovascular Diseases contribute 29.3% of total deaths in world. • Online ECG monitoring in ICUs/CCUs. • Acting Specialist in emergency cases. • Each component (P,QRS,T waves) has different frequencies. • Each individual is different. • Learning by experience.
What is Electrocardiogram (ECG) ? • ECG is the graphic recording of electric potentials generated by the heart. • 12 lead ECG • 3 bipolar limb leads – I, II, III • 3 unipolar augmented limb leads - AVF, AVR, AVL • 6 unipolar chest leads – V1 to V6.
Anatomy of Heart and ECG signal Normal ECG signal Conducting System of Heart
Posterior Anterior The 12 Views of the Heart Limb leads orientation with respect to heart Chest leads orientation with respect to heart
12 Lead Normal ECG 6 Chest leads 6 Limb leads RR
ECG and diseases Some of the diseases diagnosed by ECG are: • Myocardial Ischemia/Infarction. • Arrhythmias. • Hypertrophy and enlargement of heart. • Conduction Blocks. • Preexcitation Syndromes. • Other cardiac disorders.
Did you know !! • In heart Transplant Acute heart rejection is more likely to happen when the heart donor was female regardless of recipient sex. • Every 34 seconds, a person dies from Heart Diseases in the United States.
Myocardial Ischemia • Due to lack of adequate blood flow to the myocardium. • Ischemia is reversible. • Changes in ECG: • T wave peaking • Symmetric T wave inversion • ST segment elevation
Normal Signal ST segment elevated signal ECG Signal with peak T waves ECG with T wave inversion Myocardial Ischemia cont.. Different ECG Signals
Arrhythmias • It refers to any disturbance in the rate, regularity, site of origin, or conduction of cardiac electrical impulse. • Broadly two types: • Tachycardia – Heart Rate beyond 100 bits/minute. • Bradycardia – Heart Rate below 60 bits/minute.
Normal ECG Signal ECG signal of Bradycardia patient ECG signal of Tachycardia patient Arrhythmias cont .. Different ECG Signals
Sensitivity (SE) and Specificity (SP) • Helps us to explore the relationship between a diagnostic test and the (true) presence or absence of disease. • A test which is very sensitive will rarely miss people with the disease. • A specific test will have few false positive results - it will rarely misclassify people without the disease as being diseased. • Classification Rate: CC = 100×(TP+TN)/(TN+TP+FN+FP)]
Approach • Variable attributes considered to affect the training and generalization of the ANNs were identified as follows: • Number of nodes in the hidden layer • Feature Selection method employed • Number of files in training set • Size of input feature vector • Number of epochs
Case Study Feature Extraction: • Fourier Transform • Principal component analysis (PCA) • widely used in signal processing, statistics, and neural computing. • basic goal is to reduce the dimension of the data. • Linear Prediction Coding (LPC)
Fourier Transform • QRS complex is extracted by applying a window of some time duration (say 250 ms). • Each QRS complex is Fourier transformed and then the power spectrum is calculated. • The components generated along with the temporal vectors give the feature vector.
PCA • Step 1: Get some data • Step 2: Subtract the mean • Step 3: Calculate the covariance matrix • Step 4: Calculate the eigenvectors and eigenvalues of the covariance matrix • Step 5: Choosing components and forming a feature vector • Step 6: Deriving the new data set
Linear Prediction Coding (LPC) • The basic idea of this technique is that sampled QRS segment can be approximated as a linear combination of the past QRS samples. • a is the i th linear prediction coefficient, and p is the order of the predictor. • LPC coefficients can be extracted using various methods viz Burg’s Method.
Training the NN • Number of neurons in the input layer is determined by the number of elements in the input feature vector. • The output layer is determined by the number of classes desired. • The number of neurons in the hidden layer varies according to the specific recognition task and is determined by the complexity and amount of training data available.
Performance Analysis • The performance of the neural classifiers is evaluated by computing the percentages of: • sensitivity (SE), • specificity (SP) and • correct classification (CC)
Results Cont. • How does ANN based classification compare with: • Other ECG widely used interpretation program? • Neural networks were 15.5% more sensitive • Expert cardiologist • 10.5% more sensitive than the cardiologist
Conclusion • Performance of the neural network strategy has shown higher performance than other classical methods (Cox regression models) in predicting clinical outcomes of the risk of coronary artery disease.
References • [1] M. A. Chikh, F. Bereksi Reguig. Application of artificial neural networks to identify the premature ventricular contraction (PVC) beats,2004 • [2] Costas Papaloukasa, Dimitrios I. Fotiadisb, Aristidis Likasb, Lampros K. Michalis. An ischemia detection method based on artificial neural networks,2002 • [3] C.D. Nugent, J.A.C. Webb, N.D. Black, G.T.H. Wright, M. McIntyre. An intelligent framework for the classification of the 12-lead ECG, 1999.
Introduction to Neural Networks in Healthcare, Open Clinic, 2002. • [4] M.S. Thaler, The Only EKG Book You’ll Ever Need 3rd Edition, Lippincott Williams & Wilkins. • P.J Mehta, Understanding ECG, 5th Edition, The National Book Depot.
Believe it or NOT !! • How much blood does your heart pump? • An average heart pumps 2.4 ounces (70 milliliters) per heartbeat. An average heartbeat is 72 beats per minute. Therefore an average heart pumps 1.3 gallons (5 Liters) per minute. In other words it pumps 1,900 gallons (7,200 Liters) per day, almost 700,000 gallons (2,628,000 Liters) per year, or 48 million gallons (184,086,000 liters) by the time someone is 70 years old. That's not bad for a 10 ounce pump! • Men suffer heart attacks about 10 years earlier in life than women do.