Download
1 / 44
440 likes | 537 Views
Dive deep into hypothesis testing in statistics and learn about the pitfalls to avoid, differentiating statistically significant results from really significant ones, and the importance of the t-distribution for unknown standard deviation. Get ready for your upcoming midterm II with helpful tips and examples for better grasping the concept.

E N D
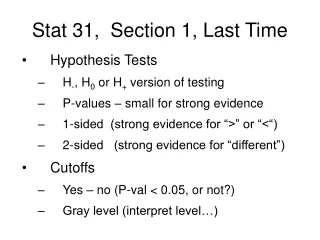
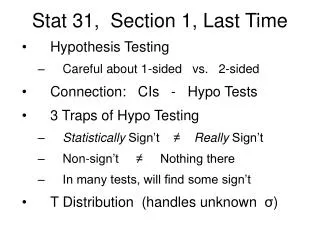
Stat 31, Section 1, Last Time • Hypothesis Testing • Careful about 1-sided vs. 2-sided • Connection: CIs - Hypo Tests • 3 Traps of Hypo Testing • Statistically Sign’t ≠ Really Sign’t • Non-sign’t ≠ Nothing there • In many tests, will find some sign’t • T Distribution (handles unknown σ)
Reading In Textbook Approximate Reading for Today’s Material: Pages 450-471, 485-504 Approximate Reading for Next Class: Pages 536-549
Midterm II Coming on Tuesday, April 10 Think about: • Sheet of Formulas • Again single 8 ½ x 11 sheet • New, since now more formulas • Redoing HW… • Asking about those not understood • Will schedule Extra Office Hours
Sec. 7.1: Deeper look at Inference Recall: “inference” = CIs and Hypo Tests Main Issue: In sampling distribution Usually is unknown, so replace with an estimate, . For n large, should be “OK”, but what about: • n small? • How large is n “large”?
Unknown SD Approach: Account for “extra variability in the approximation” Mathematics: Assume individual I.e. • Data have mound shaped histogram • Recall averages generally normal • But now must focus on individuals
Unknown SD Then Replace by , then has a distribution named: “t-distribution with n-1 degrees of freedom”
t - Distribution Notes: • n is a parameter (like ) that controls “added variability from approximation
t - Distribution Notes: • Careful: set “degrees of freedom” = = n – 1 (not n) • Easy to forget later • Good to add to sheet of notes for exam
t - Distribution Notes: • Must work with standardized version of i.e. • No longer can plug mean and SD • into EXCEL formulas • In text this was already done, • Since need this for Normal table calc’ns
t - Distribution Notes: • Calculate t probs, i.e. areas, using TDIST & TINV Caution: these are set up differently from NORMDIST & NORMINV See Class Example 26 http://stat-or.unc.edu/webspace/postscript/marron/Teaching/stor155-2007/Stor155Eg26.xls
EXCEL Functions Summary: Normal: plug in:get out: NORMDIST: cutoff area NORMINV: area cutoff (but TDIST is set up really differently)
EXCEL Functions t distribution: 1 tail: plug in:get out: TDIST: cutoff area EXCEL notes: - no explicit inverse - backwards from Normal…
EXCEL Functions t distribution: Area 2 tail: plug in:get out: TDIST: cutoff area TINV: area cutoff (EXCEL note: this one has the inverse)
EXCEL Functions Note: when need to invert the 1-tail TDIST, Use twice the area. Area = A Area = 2 A
t - Distribution HW: C21 For T ~ t, with degrees of freedom: (a) 3 (b) 12 (c) 150 (d) N(0,1) Find: • P{T> 1.7} (0.094, 0.057, 0.046, 0.045) • P{T < 2.14} (0.939, 0.973, 0.983, 0.984) • P{T < -0.74} (0.256, 0.237, 0.230, 0.230) • P{T > -1.83} (0.918, 0.954, 0.965, 0.966)
t - Distribution HW: C21 • P{|T| > 1.18} (0.323, 0.261, 0.240, 0.238) • P{|T| < 2.39} (0.903, 0.966, 0.982, 0.983) • P{|T| < -2.74} (0, 0, 0, 0) • C so that 0.05 = P{|T| > C} (3.18, 2.17, 1.98, 1.96) • C so that 0.99 = P{|T| < C} (5.84, 3.05, 2.61, 2.58)
t - Distribution Application 1: Confidence Intervals Recall: margin of error from NORMINV or CONFIDENCE Using TINV? Careful need to standardize
t - Distribution Using TINV? Careful need to standardize # spaces on number line Need to work in to use TINV
t - Distribution distribution So want: i.e. want:
t - Distribution Terminology: TINV(0.05,n-1) is called a critical value (from connection between CIs and Tests) HW: 7.19
t - Distribution Class Example 27, Part I http://stat-or.unc.edu/webspace/postscript/marron/Teaching/stor155-2007/Stor155Eg27.xls Old text book problem 7.24: In a study of DDT poisoning, researchers fed several rats a measured amount. They measured the “absolutely refractory period” required for a nerve to recover after a stimulus. Measurements on 4 rats gave:
t - Distribution Class Example 27, Part I http://stat-or.unc.edu/webspace/postscript/marron/Teaching/stor155-2007/Stor155Eg27.xls Old text book problem 7.24: Measurements on 4 rats gave: 1.6 1.7 1.8 1.9 a) Find the mean refractory period, and the standard error of the mean b) Give a 95% CI for the mean “absolutely refractory period” for all rats of this strain
t - Distribution Confidence Interval HW: 7.5, 7.7
And now for somethingcompletely different… Two issues: • What do professional statisticians think about EXCEL? • Why are the EXCEL functions so poorly organized?
And now for somethingcompletely different… Professional Statisticians Dislike Excel: Very poor handling of numerics Unacceptable?!? Jeff Simonoff Example: http://www.stern.nyu.edu/~jsimonof/classes/1305/pdf/excelreg.pdf
And now for somethingcompletely different… A similar example: Class Example 28: http://stat-or.unc.edu/webspace/postscript/marron/Teaching/stor155-2007/Stor155Eg28.xls Problem 1: Excel doesn’t keep enough significant digits (relative to other software) [single precision vs. double precision]
And now for somethingcompletely different… Problem 2: Excel doesn’t warn when troubles are encountered… • All software has this problem sometimes • But is easy to provide warnings… • “Competent software does this…”
And now for somethingcompletely different… More discussion of Excel accuracy issues: http://www.bus.ualberta.ca/eerkut/TMSSdraft3.html By Erhan Erkut, University of Alberta: http://www.bus.ualberta.ca/eerkut/
And now for somethingcompletely different… Why are the EXCEL functions so poorly organized? E.g. NORMDIST uses left areas TDIST uses right or 2-sided areas E.g. NORMINV uses left areas TINV uses 2-sided areas More to come…
And now for somethingcompletely different… Why are the EXCEL functions so poorly organized? Looks like programmer was handed a statistics text, and told “turn these into functions”… Problem: organization was good for table look ups, but looks clunky now…
And now for somethingcompletely different… Fun personal story: • Colin Bell AT Microsoft heard about “complaints from statisticians on EXCEL” • Decided to “try to fix these” • Contacted Jeff Simonoff about numerics • Asked Jeff to work with him • Jeff refused, doesn’t like or use EXCEL
And now for somethingcompletely different… Fun personal story: • Jeff told Colin about me • Colin asked me • I agreed about numerical problems, but said I had bigger objections about organization • Colin asked me to write these up
And now for somethingcompletely different… Fun personal story: • I said I was too busy, but… • I would teach (similar course) soon. • I offered to send an email, every time I noted an organizational inconsistency • Over the semester, I sent around 30 emails about all of these
And now for somethingcompletely different… Fun personal story: • Colin agreed with each of the points made • Colin approached the statistical people at Microsoft • They agreed that organization could have been done better
And now for somethingcompletely different… Fun personal story: • But for “backwards compatibility” reasons, refused to change anything • Colin apologetically archived all my emails…
And now for somethingcompletely different… How much should we worry: • Organization is a pain, but you can live with it (OK to complain when you feel like it) • Usually (except for weird rounding) numerical issues don’t arise, but need to be aware of potential!
t - Distribution Application 2: Hypothesis Tests Idea: Calculate P-values using TDIST
t – Distribution Hypo Testing E.g. Old Textbook Example 7.26 For the above DDT poisoning example, Suppose that the mean “absolutely refractory period” is known to be 1.3. DDT poisoning should slow nerve recovery, and so increase this period. Do the data give good evidence for this supposition?
t – Distribution Hypo Testing E.g. Old Textbook Example 7.26 Let = population mean absolutely refractory period for poisoned rats. (from before)
t – Distribution Hypo Testing E.g. Old Textbook Example 7.26 P-value = P{what saw or more conclusive | H0 – HA Bdry}
t – Distribution Hypo Testing E.g. Old Textbook Example 7.26 From Class Example 27, part 2: http://stat-or.unc.edu/webspace/postscript/marron/Teaching/stor155-2007/Stor155Eg27.xls = 0.003 Interpretation: very strong evidence, for either yes-no or gray-level
t – Distribution Hypo Testing Variations: • For “opposite direction” hypotheses: P-value = Then use symmetry, i.e. put - into TDIST.
t – Distribution Hypo Testing Variations: • For 2-sided hypotheses: Use 2-tailed version of TDIST.
t – Distribution Hypo Testing HW: 7.13 7.16 (0.04), 7.17, 7.21 a, f Interpret P-values: (i) yes-no (ii) gray-level