Download
1 / 11
110 likes | 227 Views
Detention Ponds & Bacterial Concentrations . Howard Chang CE394K Spring 2008. Introduction. Study Area: Round Rock, TX Brushy Creek is impaired for bacteria. Objectives. Bring Brushy Creek back into compliance Put in detention ponds where needed

E N D
Detention Ponds & Bacterial Concentrations Howard Chang CE394K Spring 2008
Introduction Study Area: Round Rock, TX Brushy Creek is impaired for bacteria
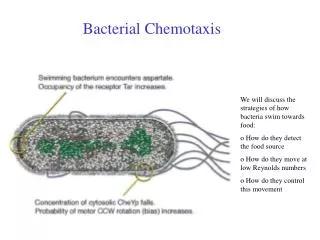
Objectives Bring Brushy Creek back into compliance Put in detention ponds where needed Hold water long enough for bacteria to die off http://www.stormwatercenter.net/Manual_Builder/design%20examples/pond/title%20figure.gif
Approach E. Coli data from TCEQ stations Travel time from NHD plus flow data Calculate decay rate Size detention pond
Analysis 200 342 342 87 90 201 12056 12062 12060 12069 12068 Average E. Coli concentrations in org/100mL Decay Rate 12062 – 12060 0.144 /hr 12060 – 12056 0.017 /hr
Where to Place Detention Pond Assume linear increase in bacteria concentration 12069 – 12068 12068 – 12062 Allowable conc = 126 org/100mL http://www.epa.gov/waterscience/standards/wqslibrary/tx/tx-wqs-20061215.pdf 90 342 87 <90 201 74 200 12062 12069 12060 12068 0 126 0 126 1.94 mi 5.16 mi 3.22 mi 0.67 mi 2 mi
Sizing the Detention Pond • A decay rate of .144 takes 34 hours to reach 0 • Not feasible: too long & needs large storage volume Parameters • Detention time 12 hrs brings 126 to 22 • Side slope 3:1 • Depth 6 feet • Width: Length 2:3 • Average flow 36 cfs inflow = outflow
Sizing the Detention Pond Needed storage volume = 36 ac-ft Detention Pond dimensions Base Top Lo 604’ L 640’ Wo 403’ W 439’ 6.5 ac
Readjust Detention Pond Location Next Steps • Check locations • Make sure it is suitable for placing detention pond • Add safety factor 112 342 87 <112 201 200 96 12062 12069 12060 12068 126 22 126 22 0.67 mi 1.17 mi
Summary • Place two detention ponds • Storage volume of 36 ac-ft • Detention time of 12 hours • Reduces bacteria concentrations to 22 org/100mL • First pond 0.67 miles downstream of station 12069 • Second pond 1.17 miles downstream of station 12068