Download
1 / 39
390 likes | 512 Views
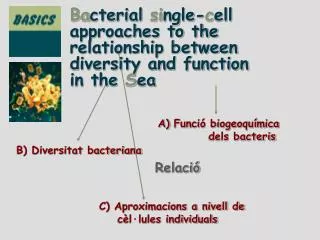
Funció biogeoquímica dels bacteris. B) Diversitat bacteriana. C) Aproximacions a nivell de cèl·lules individuals. Ba cterial si ngle- c ell approaches to the relationship between diversity and function in the S ea. Relació. L’objectiu final del projecte.

E N D
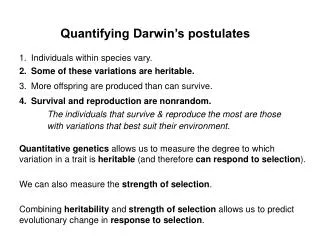
Funció biogeoquímica dels bacteris B) Diversitat bacteriana C) Aproximacions a nivell de cèl·lules individuals Bacterial single-cell approaches to the relationship between diversity and function in the Sea Relació
L’objectiu final del projecte Roundicoccus southamptii Dalibacter banyuleus 75% de la BCD consumit preferentment pels HNF molt sensitiu a l’atac viral domina la incorporació de DMSP Spirovibrio kalmariensis Tinymonas bremenensis (tots els noms són inventats)
BASICS Ocean Projects in IGBP II
Diatoms Prasinophytes Prymnesiophytes Prochlorococcus Synechococcus Phyto Does it matter what biology is hidden within each box? T. Michaels Phyto
Zoo Phyto
Bacteria are abundant and important But We are unable of grouping them in biogeochemically relevant and distinct “boxes” Because we don’t know whether they all do the same, or not...
La clau: les tècniques d’anàlisi a nivell individual
fluorescently labeled tyramide HRP HRP HRP HRP protein Permeabilization Hybridization Signal Amplification Horseradish-peroxidase-labeled FISH probes and catalyzed reporter deposition (CARD) (tyramide signal amplification, TSA) MPIMM
DAPI + AU MicroFISH 35S DMSP Roseobacter + AU ICM
60 40 20 0 0 20 40 60 Aminoacids Protein 60 C C a a g % active cells 40 g g g 20 a Atlantic Ocean C C a 0 0 20 40 60 % cells in sample HMW-DOM Cytophaga g-Proteobacteria a-Proteobacteria LMW-DOM Cottrell & Kirchman 2000
Flow Citometry 103 Cytophaga/Flavovacterium FISH 102 Blue fluorescence (DNA) Roseobacter Threshold 101 100 101 102 103 Red fluorescence (protein) Abundance highly correlated with DMSP consumption SAR86 DMSP producing phytoplankton bloom in the North Sea Emiliania huxleyi y Prorocentrum minimum Zubkov et al. 2001 PML/SOC/MPIMM
Half mile from harbour Depth of 20 m One case-study, in the Bay of Blanes, July 2003 Standard station41°40´ N, 2°48´ E1 mile offshore, 20 m depth
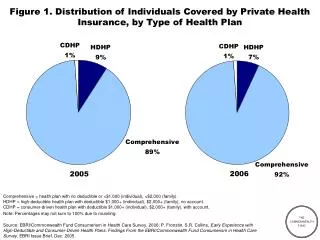
General characteristics of Blanes Bay• Typical Mediterranean waters: warm, salty and nutrient-poor• Oligotrophic coastal system (annual average chlorophyll of 0.5 µg l-1) • In summer, 1% attenuation depth of light 320 nm is at the bottom (20 m)• Relatively unaffected by human or freshwater influence• Episodic intrusions of oceanic waters caused by the Blanes canyon
Temp 26 24 22 20 18 16 14 12 10 0 180 360 540 720 900 1080 The environment - Surface temperature Temperature (°C) Julian day PICODIV BASICS 20 Mar 2001 - 27 Nov 2002 13 Jan - 25 Nov 2003
Temp Chlorophyll 2003 26 2.5 24 2 22 20 1.5 Temperatura (°C) 18 Chlorophyll 1 16 14 0.5 12 10 0 0 180 360 540 720 900 1080 Julian day Summer (June-September)’03 The environment - Surface chlorophyll Total. Mean: 0.68 µg l-1 Range: 0.21 - 2.09 µg l-1 < 3µm. Mean: 0.27 µg l-1 Range: 0.10 - 0.63 µg l-1
The seasonal changes - Primary production 14 July 2003
14 July 2003 % CTC+ cells 25 20 15 % CTC+ cells 10 5 0 The seasonal changes - Heterotrophic prokaryotes
The seasonal changes - Bacterial production & respiration 14 July 2003 BGE 2 % 63 % 20 % 3 %
Temperature (°C) % bacteria day-1 26 50 24 40 22 20 30 % bacteria day Temperature (°C) 18 20 16 -1 14 10 12 10 0 0 90 180 270 360 Julian day The seasonal changes - Bacterial grazing losses 14 July 2003
26 24 22 20 18 16 14 Temperature (° C) 12 10 The seasonal changes - Community metabolism 14 July 2003
Biolog “diversity” glycogen Higher use of polymers in July
26 24 6 1.5 10 22 20 18 6 1 10 16 14 12 SAR11 5 10 5 10 0 90 180 270 360 Roseobacter Other Alfas SAR86 Other Gammas CFB Actinobacteria Synechococcus Chloroplasts Other Bacterial diversity - Clon libraries Temperature (°C) Bacteria Julian day SAR11 SAR11 g g
Eub I-III Eury808 100 80 60 % of DAPI cells 40 20 0 0 90 180 270 360 Julian day Bacterial diversity - CARD-FISH Bacteria & Euryarchaea 14 July 2003 Bacteria: 70% (59-91%) Euryarchaea: 1.3% (0-3.6%)
The three groups Alf968 Gam42a CF319a 80 60 % of DAPI cells 40 20 0 0 90 180 270 360 Julian day Bacterial diversity - CARD-FISH main groups 14 July 2003
Bacterial diversity - proteobacteria 14 July 2003 Alteromonas !
Conclusions in July 2003... • Small bloom by flagellates, with no apparent nutrient increases • Bacteria responded to this bloom with changes in activity and diversity. • The whole community was affected (turned net autotrophic) • Carbon was accumulated in the form of bacterial cells The shift in bacterial community composition was towards g-proteobacteria (detectable as Alteromonas macleodii) which showed high metabolic versatility (used DMSP, had high exoenzyme levels, used polymers...), and relatively lower grazing pressure. During this event, most C and S appeared to circulate through this very specific bacterial group, which is, therefore, associated to a particular pattern of biogeochemical C and S cycling
Experiments of Nutrient limition of bacterial production -Monthly sampling -250 ml unfiltered seawater -Additions of: 20 µM C (glucose) 20 µM C (DMSP) 4 µM N (ammonium) 1 µM P (phosphate) -24 h incubation -Measure leucine incorp.
Changes in dominant bacteria in seawater cultures - mimicking succession in situ Jul Jan Jan Jun Mar Oct Sep Feb Apr Dec Mar Aug Nov May 2003 2004
Identity of bacteria in the seawater cultures Vibrio & Alteromonas Roseobacter clade Cryomorphaceae Flavobacteria Note the color code
Plate counts from Blanes Bay after stormy weather 10x 100x Representatives of alpha- and gamma-proteobacteria and Bacteroidetes can all be found here
Sequenced by the Moore foundation DGGE band sequences Other Blanes isolates Blanes clon libraries An all-together tree
• Els aïllats seqüenciats semblen ser representatius • Són abundants in situ ? mirar-ho • Com interaccionen amb l’entorn ? (nutrients, etc.) cal mirar quan i com es desenvolupen quines característiques enzimàtiques tenen Per poder aprofitar la informació genòmica ! This is a joint venture by Jarone Pinhassi, Pep Gasol, Carles Pedrós-Alió & the Basics gang