Download
1 / 64
640 likes | 733 Views
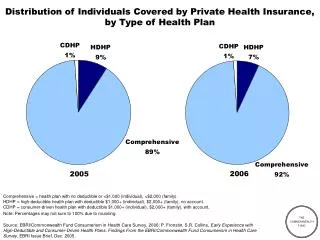
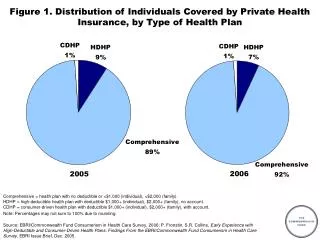
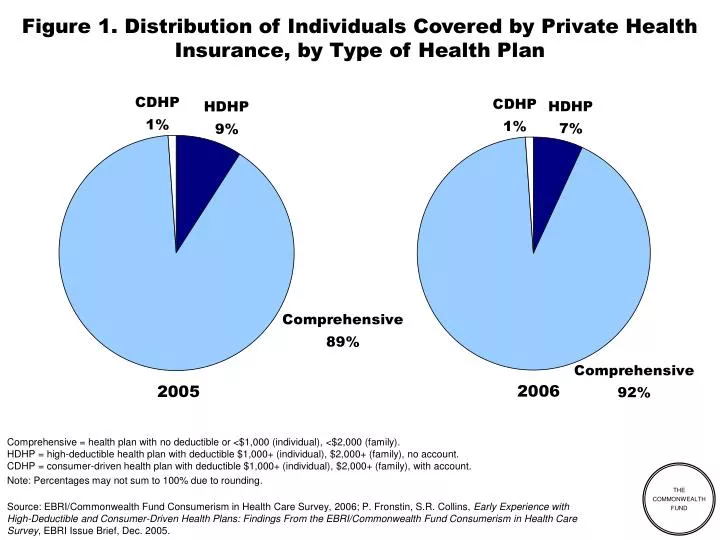
Figure 1. Distribution of Individuals Covered by Private Health Insurance, by Type of Health Plan. 2006. 2005.

E N D
Figure 1. Distribution of Individuals Covered by Private Health Insurance, by Type of Health Plan 2006 2005 Comprehensive = health plan with no deductible or <$1,000 (individual), <$2,000 (family).HDHP = high-deductible health plan with deductible $1,000+ (individual), $2,000+ (family), no account.CDHP = consumer-driven health plan with deductible $1,000+ (individual), $2,000+ (family), with account. Note: Percentages may not sum to 100% due to rounding. Source: EBRI/Commonwealth Fund Consumerism in Health Care Survey, 2006; P. Fronstin, S.R. Collins, Early Experience with High-Deductible and Consumer-Driven Health Plans: Findings From the EBRI/Commonwealth Fund Consumerism in Health Care Survey, EBRI Issue Brief, Dec. 2005.
Figure 2. Selected Demographics, by Type of Health Plan Comprehensive = health plan with no deductible or <$1,000 (individual), <$2,000 (family). HDHP = high-deductible health plan with deductible $1,000+ (individual), $2,000+ (family), no account. CDHP = consumer-driven health plan with deductible $1,000+ (individual), $2,000+ (family), with account. *Difference between HDHP/CDHP and Comprehensive is statistically significant at p ≤ 0.05 or better. Source: EBRI/Commonwealth Fund Consumerism in Health Care Survey, 2006.
Figure 3. Household Income and Education, by Type of Health Plan Comprehensive = health plan with no deductible or <$1,000 (individual), <$2,000 (family). HDHP = high-deductible health plan with deductible $1,000+ (individual), $2,000+ (family), no account. CDHP = consumer-driven health plan with deductible $1,000+ (individual), $2,000+ (family), with account. *Difference between HDHP/CDHP and Comprehensive is statistically significant at p ≤ 0.05 or better. Source: EBRI/Commonwealth Fund Consumerism in Health Care Survey, 2006.
Figure 4. Self-Rated Health Status, by Type of Health Plan Comprehensive = health plan with no deductible or <$1,000 (individual), <$2,000 (family). HDHP = high-deductible health plan with deductible $1,000+ (individual), $2,000+ (family), no account. CDHP = consumer-driven health plan with deductible $1,000+ (individual), $2,000+ (family), with account. *Difference between HDHP/CDHP and Comprehensive is statistically significant at p ≤ 0.05 or better. **Arthritis; asthma, emphysema or lung disease; cancer; depression; diabetes; heart attack or other heart disease; high cholesterol; or hypertension, high blood pressure or stroke. ***Health problem defined as fair or poor health or one of eight chronic health conditions. Source: EBRI/Commonwealth Fund Consumerism in Health Care Survey, 2006.
Figure 5. Distribution of Privately Insured Adults, by Firm Size Percent of adults 21–64 who are employed full- or part-time or are self-employed/business owner Comprehensive = health plan with no deductible or <$1,000 (individual), <$2,000 (family). HDHP = high-deductible health plan with deductible $1,000+ (individual), $2,000+ (family), no account. CDHP = consumer-driven health plan with deductible $1,000+ (individual), $2,000+ (family), with account. *Difference between HDHP/CDHP and Comprehensive is statistically significant at p ≤ 0.05 or better. Source: EBRI/Commonwealth Fund Consumerism in Health Care Survey, 2006.
Figure 6. Number of Years Covered by Current Health Plan, by Type of Health Plan Percent of privately insured adults 21–64 Comprehensive = health plan with no deductible or <$1,000 (individual), <$2,000 (family). HDHP = high-deductible health plan with deductible $1,000+ (individual), $2,000+ (family), no account. CDHP = consumer-driven health plan with deductible $1,000+ (individual), $2,000+ (family), with account. *Difference between HDHP/CDHP and Comprehensive is statistically significant at p ≤ 0.05 or better. Source: EBRI/Commonwealth Fund Consumerism in Health Care Survey, 2006.
Figure 7. Familiarity with Consumer-Driven Health Plans, 2006 Percent of privately insured adults 21–64 Comprehensive = health plan with no deductible or <$1,000 (individual), <$2,000 (family). HDHP = high-deductible health plan with deductible $1,000+ (individual), $2,000+ (family), no account. CDHP = consumer-driven health plan with deductible $1,000+ (individual), $2,000+ (family), with account. *Difference between HDHP/CDHP and Comprehensive is statistically significant at p ≤ 0.05 or better. Source: EBRI/Commonwealth Fund Consumerism in Health Care Survey, 2006.
Figure 8. Familiarity with Consumer-Driven Health Plans, 2005–2006 Percent of privately insured adults 21–64 Source: EBRI/Commonwealth Fund Consumerism in Health Care Survey, 2005 and 2006.
Figure 9. Percent of Privately Insured Adults Who Did Not Have Health Insurance Before Enrolling in Their Current Plan, by Coverage Source Percent of privately insured adults 21–64 Comprehensive = health plan with no deductible or <$1,000 (individual), <$2,000 (family). HDHP = high-deductible health plan with deductible $1,000+ (individual), $2,000+ (family), no account. CDHP = consumer-driven health plan with deductible $1,000+ (individual), $2,000+ (family), with account. *Difference between HDHP/CDHP and Comprehensive is statistically significant at p ≤ 0.05 or better. Source: EBRI/Commonwealth Fund Consumerism in Health Care Survey, 2006.
Figure 10. Satisfaction with Quality of Health Care Received, by Type of Health Plan, 2006 Percent of privately insured adults 21–64 Comprehensive = health plan with no deductible or <$1,000 (individual), <$2,000 (family). HDHP = high-deductible health plan with deductible $1,000+ (individual), $2,000+ (family), no account. CDHP = consumer-driven health plan with deductible $1,000+ (individual), $2,000+ (family), with account. *Difference between HDHP/CDHP and Comprehensive is statistically significant at p ≤ 0.05 or better. Source: EBRI/Commonwealth Fund Consumerism in Health Care Survey, 2006.
Figure 11. Percent of Individuals Extremely or Very Satisfied with Quality of Health Care Received, by Type of Health Plan, 2005–2006 Percent of privately insured adults 21–64 extremely/very satisfied Source: EBRI/Commonwealth Fund Consumerism in Health Care Survey, 2006. Comprehensive = health plan with no deductible or <$1,000 (individual), <$2,000 (family). HDHP = high-deductible health plan with deductible $1,000+ (individual), $2,000+ (family), no account. CDHP = consumer-driven health plan with deductible $1,000+ (individual), $2,000+ (family), with account. *Difference between HDHP/CDHP and Comprehensive is statistically significant at p ≤ 0.05 or better. ^Difference between 2005 and 2006 is statistically significant at p < 0.05 or better.
Figure 12. Satisfaction with Out-of-Pocket Costs for Health Care, by Type of Health Plan, 2006 Percent of privately insured adults 21–64 Comprehensive = health plan with no deductible or <$1,000 (individual), <$2,000 (family). HDHP = high-deductible health plan with deductible $1,000+ (individual), $2,000+ (family), no account. CDHP = consumer-driven health plan with deductible $1,000+ (individual), $2,000+ (family), with account. *Difference between HDHP/CDHP and Comprehensive is statistically significant at p ≤ 0.05 or better. Source: EBRI/Commonwealth Fund Consumerism in Health Care Survey, 2006.
Figure 13. Percent of Individuals Extremely or Very Satisfied with Out-of-Pocket Costs for Health Care, by Type of Health Plan, 2005–2006 Percent of privately insured adults 21–64 extremely/very satisfied Comprehensive = health plan with no deductible or <$1,000 (individual), <$2,000 (family). HDHP = high-deductible health plan with deductible $1,000+ (individual), $2,000+ (family), no account. CDHP = consumer-driven health plan with deductible $1,000+ (individual), $2,000+ (family), with account. *Difference between HDHP/CDHP and Comprehensive is statistically significant at p ≤ 0.05 or better. ^Difference between 2005 and 2006 is statistically significant at p < 0.05 or better. Source: EBRI/Commonwealth Fund Consumerism in Health Care Survey, 2006.
Figure 14. Satisfaction with Choice of Doctors, by Type of Health Plan, 2006 Comprehensive = health plan with no deductible or <$1,000 (individual), <$2,000 (family). HDHP = high-deductible health plan with deductible $1,000+ (individual), $2,000+ (family), no account. CDHP = consumer-driven health plan with deductible $1,000+ (individual), $2,000+ (family), with account. *Difference between HDHP/CDHP and Comprehensive is statistically significant at p ≤ 0.05 or better. Source: EBRI/Commonwealth Fund Consumerism in Health Care Survey, 2006.
Figure 15. Percent of Individuals Extremely or Very Satisfied with Choice of Doctors, by Type of Health Plan, 2005–2006 Comprehensive = health plan with no deductible or <$1,000 (individual), <$2,000 (family). HDHP = high-deductible health plan with deductible $1,000+ (individual), $2,000+ (family), no account. CDHP = consumer-driven health plan with deductible $1,000+ (individual), $2,000+ (family), with account. *Difference between HDHP/CDHP and Comprehensive is statistically significant at p ≤ 0.05 or better. ^Difference between 2005 and 2006 is statistically significant at p < 0.05 or better. Source: EBRI/Commonwealth Fund Consumerism in Health Care Survey, 2006.
Figure 16. Overall Satisfaction with Health Plan,by Type of Health Plan, 2006 Percent of privately insured adults 21–64 Comprehensive = health plan with no deductible or <$1,000 (individual), <$2,000 (family). HDHP = high-deductible health plan with deductible $1,000+ (individual), $2,000+ (family), no account. CDHP = consumer-driven health plan with deductible $1,000+ (individual), $2,000+ (family), with account. *Difference between HDHP/CDHP and Comprehensive is statistically significant at p ≤ 0.05 or better. Source: EBRI/Commonwealth Fund Consumerism in Health Care Survey, 2006.
Figure 17. Percent of Individuals Extremely or Very Satisfied with Health Plan, by Type of Health Plan, 2005–2006 Percent of privately insured adults 21–64 extremely/very satisfied Comprehensive = health plan with no deductible or <$1,000 (individual), <$2,000 (family). HDHP = high-deductible health plan with deductible $1,000+ (individual), $2,000+ (family), no account. CDHP = consumer-driven health plan with deductible $1,000+ (individual), $2,000+ (family), with account. *Difference between HDHP/CDHP and Comprehensive is statistically significant at p ≤ 0.05 or better. ^Difference between 2005 and 2006 is statistically significant at p < 0.05 or better. Source: EBRI/Commonwealth Fund Consumerism in Health Care Survey, 2006.
Figure 18. Likelihood of Recommending Health Plan to Friend or Co-Worker, by Type of Health Plan, 2006 Percent of privately insured adults 21–64 Comprehensive = health plan with no deductible or <$1,000 (individual), <$2,000 (family). HDHP = high-deductible health plan with deductible $1,000+ (individual), $2,000+ (family), no account. CDHP = consumer-driven health plan with deductible $1,000+ (individual), $2,000+ (family), with account. *Difference between HDHP/CDHP and Comprehensive is statistically significant at p ≤ 0.05 or better. Source: EBRI/Commonwealth Fund Consumerism in Health Care Survey, 2006.
Figure 19. Percent of Individuals Extremely or Very Likely to Recommend Health Plan to Friend or Co-Worker, by Type of Health Plan, 2005–2006 Percent of privately insured adults 21–64 extremely/very likely to recommend plan Comprehensive = health plan with no deductible or <$1,000 (individual), <$2,000 (family). HDHP = high-deductible health plan with deductible $1,000+ (individual), $2,000+ (family), no account. CDHP = consumer-driven health plan with deductible $1,000+ (individual), $2,000+ (family), with account. *Difference between HDHP/CDHP and Comprehensive is statistically significant at p ≤ 0.05 or better. ^Difference between 2005 and 2006 is statistically significant at p < 0.05 or better. Source: EBRI/Commonwealth Fund Consumerism in Health Care Survey, 2006.
Figure 20. Likelihood of Staying with Current Health Plan If Had the Opportunity to Change, by Type of Health Plan, 2006 Percent of privately insured adults 21–64 Comprehensive = health plan with no deductible or <$1,000 (individual), <$2,000 (family). HDHP = high-deductible health plan with deductible $1,000+ (individual), $2,000+ (family), no account. CDHP = consumer-driven health plan with deductible $1,000+ (individual), $2,000+ (family), with account. *Difference between HDHP/CDHP and Comprehensive is statistically significant at p ≤ 0.05 or better. Source: EBRI/Commonwealth Fund Consumerism in Health Care Survey, 2006.
Figure 21. Percent of Individuals Extremely or Very Likely to Stay with Current Health Plan If Had the Opportunity to Change, by Type of Health Plan, 2005–2006 Percent of privately insured adults 21–64 extremely/very likely to stay Comprehensive = health plan with no deductible or <$1,000 (individual), <$2,000 (family). HDHP = high-deductible health plan with deductible $1,000+ (individual), $2,000+ (family), no account. CDHP = consumer-driven health plan with deductible $1,000+ (individual), $2,000+ (family), with account. *Difference between HDHP/CDHP and Comprehensive is statistically significant at p ≤ 0.05 or better. ^Difference between 2005 and 2006 is statistically significant at p < 0.05 or better. Source: EBRI/Commonwealth Fund Consumerism in Health Care Survey, 2006.
Figure 22. Percent of Individuals Covered by Employment-Based Health Benefits with No Choice of Health Plan, by Type of Health Plan, 2006 Percent of adults 21–64 with employer insurance with no plan choice Comprehensive = health plan with no deductible or <$1,000 (individual), <$2,000 (family). HDHP = high-deductible health plan with deductible $1,000+ (individual), $2,000+ (family), no account. CDHP = consumer-driven health plan with deductible $1,000+ (individual), $2,000+ (family), with account. *Difference between HDHP/CDHP and Comprehensive is statistically significant at p ≤ 0.05 or better. Source: EBRI/Commonwealth Fund Consumerism in Health Care Survey, 2006.
Figure 23. Percent of Individuals Covered by Employment-Based Health Benefits with No Choice of Health Plan, by Type of Health Plan, 2005–2006 Percent of adults 21–64 with employer insurance with no plan choice Comprehensive = health plan with no deductible or <$1,000 (individual), <$2,000 (family). HDHP = high-deductible health plan with deductible $1,000+ (individual), $2,000+ (family), no account. CDHP = consumer-driven health plan with deductible $1,000+ (individual), $2,000+ (family), with account. *Difference between HDHP/CDHP and Comprehensive is statistically significant at p ≤ 0.05 or better. ^Difference between 2005 and 2006 is statistically significant at p < 0.05 or better. Source: EBRI/Commonwealth Fund Consumerism in Health Care Survey, 2006.
Figure 24. Agreement with Statements About Health Plan: Percent Reporting That They Strongly or Somewhat Agree, by Type of Health Plan Percent of privately insured adults 21–64 who strongly/somewhat agree Comprehensive = health plan with no deductible or <$1,000 (individual), <$2,000 (family). HDHP = high-deductible health plan with deductible $1,000+ (individual), $2,000+ (family), no account. CDHP = consumer-driven health plan with deductible $1,000+ (individual), $2,000+ (family), with account. *Difference between HDHP/CDHP and Comprehensive is statistically significant at p ≤ 0.05 or better. Source: EBRI/Commonwealth Fund Consumerism in Health Care Survey, 2006.
Figure 25. Percent of Individuals Reporting That They Strongly or Somewhat Agree That Health Plan is Easy to Understand, by Type of Health Plan, 2005–2006 Percent of privately insured adults 21–64 who strongly/somewhat agree Comprehensive = health plan with no deductible or <$1,000 (individual), <$2,000 (family). HDHP = high-deductible health plan with deductible $1,000+ (individual), $2,000+ (family), no account. CDHP = consumer-driven health plan with deductible $1,000+ (individual), $2,000+ (family), with account. *Difference between HDHP/CDHP and Comprehensive is statistically significant at p ≤ 0.05 or better. ^Difference between 2005 and 2006 is statistically significant at p < 0.05 or better. Source: EBRI/Commonwealth Fund Consumerism in Health Care Survey, 2006.
Figure 26. Percent of Individuals Reporting That They Strongly or Somewhat Agree that Health Plan Will Protect Them in the Event of an Expensive Illness, by Type of Health Plan, 2005–2006 Comprehensive = health plan with no deductible or <$1,000 (individual), <$2,000 (family). HDHP = high-deductible health plan with deductible $1,000+ (individual), $2,000+ (family), no account. CDHP = consumer-driven health plan with deductible $1,000+ (individual), $2,000+ (family), with account. *Difference between HDHP/CDHP and Comprehensive is statistically significant at p ≤ 0.05 or better. ^Difference between 2005 and 2006 is statistically significant at p < 0.05 or better. Source: EBRI/Commonwealth Fund Consumerism in Health Care Survey, 2006.
Figure 27. Percent of Individuals Reporting That They Strongly or Somewhat Agree That Health Plan Encourages Adoption of Healthier Lifestyle, by Type of Health Plan, 2005–2006 Percent of privately insured adults 21–64 who strongly/somewhat agree Comprehensive = health plan with no deductible or <$1,000 (individual), <$2,000 (family). HDHP = high-deductible health plan with deductible $1,000+ (individual), $2,000+ (family), no account. CDHP = consumer-driven health plan with deductible $1,000+ (individual), $2,000+ (family), with account. *Difference between HDHP/CDHP and Comprehensive is statistically significant at p ≤ 0.05 or better. ^Difference between 2005 and 2006 is statistically significant at p < 0.05 or better. Source: EBRI/Commonwealth Fund Consumerism in Health Care Survey, 2006.
Figure 28. Percent of Individuals Reporting That They Strongly or Somewhat Agree That Health Plan Provides Information to Help Choose Among Providers, by Type of Health Plan, 2005–2006 Comprehensive = health plan with no deductible or <$1,000 (individual), <$2,000 (family). HDHP = high-deductible health plan with deductible $1,000+ (individual), $2,000+ (family), no account. CDHP = consumer-driven health plan with deductible $1,000+ (individual), $2,000+ (family), with account. *Difference between HDHP/CDHP and Comprehensive is statistically significant at p ≤ 0.05 or better. ^Difference between 2005 and 2006 is statistically significant at p < 0.05 or better. Source: EBRI/Commonwealth Fund Consumerism in Health Care Survey, 2006.
Figure 29. Agreement with Statements About Priorities forthe Health Care System: Percent Reporting That They Strongly or Somewhat Agree, by Type of Health Plan Percent of privately insured adults 21–64 who strongly/somewhat agree Comprehensive = health plan with no deductible or <$1,000 (individual), <$2,000 (family). HDHP = high-deductible health plan with deductible $1,000+ (individual), $2,000+ (family), no account. CDHP = consumer-driven health plan with deductible $1,000+ (individual), $2,000+ (family), with account. *Difference between HDHP/CDHP and Comprehensive is statistically significant at p ≤ 0.05 or better. Source: EBRI/Commonwealth Fund Consumerism in Health Care Survey, 2006.
Figure 30. Premium of Selected Plan Compared with Other Available Plans, Among Individuals with Choice of Plans and Those in the Individual Market, by Type of Health Plan Percent of privately insured adults 21–64 with choice of plan Comprehensive = health plan with no deductible or <$1,000 (individual), <$2,000 (family). HDHP = high-deductible health plan with deductible $1,000+ (individual), $2,000+ (family), no account. CDHP = consumer-driven health plan with deductible $1,000+ (individual), $2,000+ (family), with account. *Difference between HDHP/CDHP and Comprehensive is statistically significant at p ≤ 0.05 or better. Source: EBRI/Commonwealth Fund Consumerism in Health Care Survey, 2006.
Figure 31. Percent of Individuals with Comprehensive Employment-Based Health Benefits and Choice of Health Plan Offered CDHP 9% Don’t know if CDHP or HDHP was offered 39% Offered HDHP 13% HDHP or CDHP offered 11% Not offered a CDHP or HDHP 28% Comprehensive = health plan with no deductible or <$1,000 (individual), <$2,000 (family). HDHP = high-deductible health plan with deductible $1,000+ (individual), $2,000+ (family), no account. CDHP = consumer-driven health plan with deductible $1,000+ (individual), $2,000+ (family), with account. Source: EBRI/Commonwealth Fund Consumerism in Health Care Survey, 2006.
Figure 32. Reasons for Deciding Not to Open a Health Savings Account Percent of privately insured adults 21–64 with HDHPs with option to open a health savings account but did not HDHP = high-deductible health plan with deductible $1,000+ (individual), $2,000+ (family), no account. Source: EBRI/Commonwealth Fund Consumerism in Health Care Survey, 2006.
Figure 33. Percent of Individuals with Employer Contribution to Account, Among Persons with Employment-Based Health Benefits and CDHP Don’t know 3% No employer contributions 32% Employer contributes to account 65% CDHP = consumer-driven health plan with deductible $1,000+ (individual), $2,000+ (family), with account. Source: EBRI/Commonwealth Fund Consumerism in Health Care Survey, 2006.
Figure 34. Annual Employer Contributions to the Account, Among Persons with CDHP Whose Employer Contributes to Account Less than $200 7% Don’t know 8% $200–$499 15% $1,000 or more 43% $500–$749 18% $750–$999 9% CDHP = consumer-driven health plan with deductible $1,000+ (individual), $2,000+ (family), with account. Note: Both single-person and family plans. Source: EBRI/Commonwealth Fund Consumerism in Health Care Survey, 2006.
Figure 35. Annual Employer Contributions to the Account, Among Persons with CDHP Percent of adults 21–64 with CDHPs and employer contributions CDHP = consumer-driven health plan with deductible $1,000+ (individual), $2,000+ (family), with account. *Difference between individual coverage and family coverage is statistically significant at p ≤ 0.05 or better. Source: EBRI/Commonwealth Fund Consumerism in Health Care Survey, 2006.
Figure 36. Annual Employee Contributions to the Account, by Household Income, Among Persons with CDHP Percent of adults 21–64 with CDHPs CDHP = consumer-driven health plan with deductible $1,000+ (individual), $2,000+ (family), with account. *Difference between <$50,000 income and $50,000+ income is statistically significant at p ≤ 0.05 or better. Source: EBRI/Commonwealth Fund Consumerism in Health Care Survey, 2006.
Figure 37. Annual Employee Contributions to the Account, by Type of Coverage, Among Persons with CDHP Percent of adults 21–64 with CDHPs CDHP = consumer-driven health plan with deductible $1,000+ (individual), $2,000+ (family), with account. *Difference between individual coverage and family coverage is statistically significant at p ≤ 0.05 or better. Source: EBRI/Commonwealth Fund Consumerism in Health Care Survey, 2006.
Figure 38. Length of Time with CDHP and Savings Account Don’t know 1% 5 or more years 3% Less than 6 months 15% 3–4 years 9% 1–2 years 30% 6 months to less than 1 year 42% CDHP = consumer-driven health plan with deductible $1,000+ (individual), $2,000+ (family), with account. Source: EBRI/Commonwealth Fund Consumerism in Health Care Survey, 2006.
Figure 39. Amount of Money Rolled Over in the CDHP, Among Individuals with CDHP One Year or Longer, by Health Status** Percent of adults 21–64 with CDHP 1 year or more CDHP = consumer-driven health plan with deductible $1,000+ (individual), $2,000+ (family), with account. *Difference between health status categories is statistically significant at p ≤ 0.05 or better. **Health problem defined as fair or poor health or one of eight chronic health conditions. Note: Both single-person and family plans. Source: EBRI/Commonwealth Fund Consumerism in Health Care Survey, 2006.
Figure 40. Amount of Money Currently in Account, Among Individuals with a CDHP Percent of adults 21–64 with CDHPs CDHP = consumer-driven health plan with deductible $1,000+ (individual), $2,000+ (family), with account. Source: EBRI/Commonwealth Fund Consumerism in Health Care Survey, 2006.
Figure 41. Annual Deductibles, by Type of Health Plan Comprehensive = health plan with no deductible or <$1,000 (individual), <$2,000 (family). HDHP = high-deductible health plan with deductible $1,000+ (individual), $2,000+ (family), no account. CDHP = consumer-driven health plan with deductible $1,000+ (individual), $2,000+ (family), with account. Source: EBRI/Commonwealth Fund Consumerism in Health Care Survey, 2006.
Figure 42. Annual Household Premium for Health Insurance, by Type of Health Plan Comprehensive = health plan with no deductible or <$1,000 (individual), <$2,000 (family). HDHP = high-deductible health plan with deductible $1,000+ (individual), $2,000+ (family), no account. CDHP = consumer-driven health plan with deductible $1,000+ (individual), $2,000+ (family), with account. Source: EBRI/Commonwealth Fund Consumerism in Health Care Survey, 2006.
Figure 43. Percent of Adults Whose Deductibles Apply to All Medical Services, by Coverage Source Percent of privately insured adults 21–64 Comprehensive = health plan with no deductible or <$1,000 (individual), <$2,000 (family). HDHP = high-deductible health plan with deductible $1,000+ (individual), $2,000+ (family), no account. CDHP = consumer-driven health plan with deductible $1,000+ (individual), $2,000+ (family), with account. *Difference between HDHP/CDHP and Comprehensive is statistically significant at p ≤ 0.05 or better. Source: EBRI/Commonwealth Fund Consumerism in Health Care Survey, 2006.
Figure 44. Annual Household Out-of-Pocket Medical Expenses, Not Including Premiums, by Type of Health Plan Comprehensive = health plan with no deductible or <$1,000 (individual), <$2,000 (family). HDHP = high-deductible health plan with deductible $1,000+ (individual), $2,000+ (family), no account. CDHP = consumer-driven health plan with deductible $1,000+ (individual), $2,000+ (family), with account. *Difference between HDHP/CDHP and Comprehensive is statistically significant at p ≤ 0.05 or better. Source: EBRI/Commonwealth Fund Consumerism in Health Care Survey, 2006.
Figure 45. Annual Household Out-of-Pocket Medical Expenses, Including Premiums, by Type of Health Plan Comprehensive = health plan with no deductible or <$1,000 (individual), <$2,000 (family). HDHP = high-deductible health plan with deductible $1,000+ (individual), $2,000+ (family), no account. CDHP = consumer-driven health plan with deductible $1,000+ (individual), $2,000+ (family), with account. *Difference between HDHP/CDHP and Comprehensive is statistically significant at p ≤ 0.05 or better. Source: EBRI/Commonwealth Fund Consumerism in Health Care Survey, 2006.
Figure 46. Percent of Household Income Spent Annually onOut-of-Pocket Medical Expenses, by Health Status and Income Percent of privately insured adults 21–64 spending ≥ 5% of income 43* 42* 38* 38* 33* 29* 23 18 12 <$50,000Annual Income Health Problem** Total Comprehensive = health plan with no deductible or <$1,000 (individual), <$2,000 (family). HDHP = high-deductible health plan with deductible $1,000+ (individual), $2,000+ (family), no account. CDHP = consumer-driven health plan with deductible $1,000+ (individual), $2,000+ (family), with account. *Difference between HDHP/CDHP and Comprehensive is statistically significant at p ≤ 0.05 or better. **Health problem defined as fair or poor health or one of eight chronic health conditions. Source: EBRI/Commonwealth Fund Consumerism in Health Care Survey, 2006.
Figure 47. Percent of Household Income Spent Annually onOut-of-Pocket Medical Expenses, by Coverage Source Percent of privately insured adults 21–64 spending ≥ 5% of income 34* 33* 30* 30 29* (n=66) 23 18 12 12 Individual Total Employment-Based Comprehensive = health plan with no deductible or <$1,000 (individual), <$2,000 (family). HDHP = high-deductible health plan with deductible $1,000+ (individual), $2,000+ (family), no account. CDHP = consumer-driven health plan with deductible $1,000+ (individual), $2,000+ (family), with account. *Difference between HDHP/CDHP and Comprehensive is statistically significant at p ≤ 0.05 or better. Source: EBRI/Commonwealth Fund Consumerism in Health Care Survey, 2006.
Figure 48. Percent of Household Income Spent Annually on Out-of-Pocket Medical Expenses Plus Premiums, by Health Status and Income Percent of privately insured adults 21–64 spending ≥ 5% of income 66* 64* 55* 52* 51* 44* 43 28 22 <$50,000 Annual Income Total Health Problem** Comprehensive = health plan with no deductible or <$1,000 (individual), <$2,000 (family). HDHP = high-deductible health plan with deductible $1,000+ (individual), $2,000+ (family), no account. CDHP = consumer-driven health plan with deductible $1,000+ (individual), $2,000+ (family), with account. *Difference between HDHP/CDHP and Comprehensive is statistically significant at p ≤ 0.05 or better. **Health problem defined as fair or poor health or one of eight chronic health conditions. Source: EBRI/Commonwealth Fund Consumerism in Health Care Survey, 2006.
Figure 49. Percent of Household Income Spent Annually on Out-of-Pocket Medical Expenses Plus Premiums, by Coverage Source Percent of privately insured adults 21–64 spending ≥ 5% of income 60 52 (n=66) 51* 47* 45 44* 42* 22 21 Individual Total Employment-Based Comprehensive = health plan with no deductible or <$1,000 (individual), <$2,000 (family). HDHP = high-deductible health plan with deductible $1,000+ (individual), $2,000+ (family), no account. CDHP = consumer-driven health plan with deductible $1,000+ (individual), $2,000+ (family), with account. *Difference between HDHP/CDHP and Comprehensive is statistically significant at p ≤ 0.05 or better. Source: EBRI/Commonwealth Fund Consumerism in Health Care Survey, 2006.
Figure 50. Percent of Adults Who Agree That Terms of Coverage Make Them Consider Cost When Deciding to Seek Health Care Services Percent of privately insured adults 21–64 73* 61* 46 Comprehensive = health plan with no deductible or <$1,000 (individual), <$2,000 (family). HDHP = high-deductible health plan with deductible $1,000+ (individual), $2,000+ (family), no account. CDHP = consumer-driven health plan with deductible $1,000+ (individual), $2,000+ (family), with account. *Difference between HDHP/CDHP and Comprehensive is statistically significant at p ≤ 0.05 or better. Source: EBRI/Commonwealth Fund Consumerism in Health Care Survey, 2006.