Consumer Perception in Marketing
This explores consumer perception, from sensory reception to interpretation, and its impact on marketing strategies. It covers elements of perception, such as sensory thresholds, subliminal perception, Weber’s Law, and the marketing applications of just noticeable differences (JND). The text delves into how perception influences consumer behavior and decision-making, highlighting selective perception, perceptual organization, laws of perception, and distorting influences. Discover the importance of product positioning, perceived price and quality, and the role of imagery in consumer perception.

Consumer Perception in Marketing
E N D
Presentation Transcript
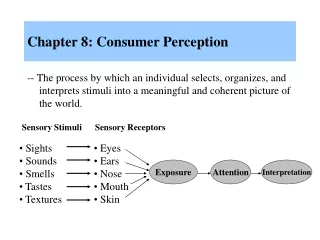
Perception The process by which an individual selects, organizes, and interprets stimuli into a meaningful and coherent picture of the world.
Elements of Perception • Sensation(Attention, Stress, Vigilance & Sleep/Wakefulness Monitoring) • The absolute threshold(Vision, Hearing, Odour) • The differential threshold(j.n.d for the product improvements and repeated sales) • Subliminal perception(new products, audio, images)
Sensory Receptors The human organs (eyes, ears, nose, mouth, skin) that receive sensory inputs.
Absolute Threshold The lowest level at which an individual can experience a sensation The smallest intensity of a stimulus that can reliably evoke a sensation.EXAMPLETHE IMPACT OF UPWARD PRICE MOVEMENTS ON DAILYHOUSEHOLD GOODS.THIS SHOWS THE IMPORTANCE OF MARKET SEGMENTATIONAND THE ASSOCIATED PRICING POLICIES.
Sensory Adaptation “Getting used to” certain sensations; becoming accommodated to a certain level of stimulation.
Differential Threshold The minimal difference that can be detected between two stimuli. Also known as the j.n.d. (just noticeable difference) this may be applicable to product line extention, selection of distribution channels, product pricing, promotions, packaging, image.
Weber’s Law A theory concerning the perceived differentiation between similar stimuli of varying intensities (i.e., the stronger the initial stimulus, the greater the additional intensity needed for the second stimulus to be perceived as different) e.g. this way we can deduct the differences when the product differences are made in the market with the attributes like the size, quality increase in price or the packaging etc..
Marketing Applications of the JND • Need to determine the relevant j.n.d. for their products • so that negative changes are not readily discernible (visionary) to the public • so that product improvements are very apparent(appearing to the eye or mind) of the consumers e.g. a manu. Increases the price of the car by irs400 is the j.n.d.
Subliminal Perception Perception of very weak or rapid stimuli received below the level of conscious awareness. -To promote unfimiliar products e.g. “Lipton ice” was flashed on computers for 24 milliseconds -Images e.g. kittens, couples, negative scenes - Audio messages e.g. Backmasking or heavy metal music
Is Subliminal Persuasion Effective? • Extensive research has shown no evidence that subliminal advertising can cause behavior changes • Some evidence that subliminal stimuli may influence affective reactions
Aspects of Perception Selection Organization Interpretation
Perceptual Selection • Depends on two major factors • Consumers’ previous experience (expectations) • Consumers’ motives
Some Marketing Variables Influencing Consumer Perception • Nature of Product • Physical Attributes of Product • Package Design • Brand Name • Advertisements & Commercials • Positioning of the Ad • Editorial Environment
Selective Perception • Selective Exposure: Consumer selects which promo messages they will expose themselves towards. • Selective Attention: Which promo messages they will pay attention towards. • Perceptual Defense: Not perceiving the stimuli because they are threatening, un-pleasent or offensive • Perceptual Blocking: Consumers avoid being bombarded by: • Tuning out of a Frequency of Media
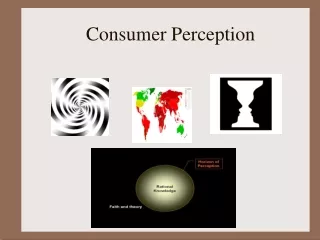
Principles of Perceptual Organization • Figure and ground (2D images) • Grouping • Closure(People have a need for closure and organize perceptions to form a complete picture i.e. impacting than a pic
Law of Closure The law of closure posits that perceptually close up, or complete, objects that are not, in fact, complete. In the above, we perceive the letters 'I', 'B', and 'M' although the shapes we see, in fact, are only lines of white space of differing length hovering above each other. Similarly, we see the figure on Paul Thagard's book (figure ) as forming a three-dimensional box although all we see, in fact, is 24 dissimilar red shapes (count for yourself!) on a dark red background. Figure is the typical textbook example of the law of closure; we perceive a circle and not 8 individual circles e.g. incomplete, familiar jingles, audio track sometime copied and inspired for the people or the customers to complete or be inspired by a new product for the same reason.
Contd.. --Law of similarity --Law of Symmetry --Law of Proximity
Distorting Influences • Physical Appearances • Stereotypes • Irrelevant Cues(internal & external) • First Impressions • Jumping to Conclusions • Halo Effect(Biasing on the items of a Broader Brand is the better one!)
Issues In Consumer Imagery • Product Positioning and Repositioning • Positioning of Services • Perceived Price • Perceived Quality • Retail Store Image • Manufacturers Image • Perceived Risk
Positioning Establishing a specific image for a brand in relation to competing brands.
Reposition Changing the way a product is perceived by consumers in relation to other brands or product uses.
Perceptual Mapping A research technique that enables marketers to plot graphically consumers’ perceptions concerning product attributes of specific brands.
Perceptual Mapping Fashion Coverage Fashion Splash More Copy More Artwork Crash Bash Splash Club Coverage
Perceptual Map Gentleness Pain Relievers (perceptual map) • Tylenol Effectiveness • Bayer • Advil • Private-label Aspirin • Nuprin • Anacin • Excedrin
Was $199 Sale! Now $99 Issues in Perceived Price • Reference prices(comparing and referencing different prices in the minds) • Tensile(non-specified) and objective(specified) price claims 20% to 70% Off!
Reference Price Any price that a consumer uses as a basis for comparison in judging another price.
Was $199 Sale! Now $99 Reference Prices • External Reference Price(based on the price in the world likely other countries) • Internal Reference Price(based on alternatives which are under priced) $89
Tensile and Objective Price Claims • Evaluations least favorable for ads stating the minimum discount level • Ads stating maximum discount levels are better than stating a range Save 10% or more Save upto 50%
Perceived Quality • Perceived Quality of Products • Intrinsic vs. Extrinsic Cues • Perceived Quality of Services • Price/Quality Relationship
Intrinsic Cues Physical characteristics of the product (such as size, color, flavor, or aroma) that serve to influence the consumer’s perceptions of product quality.
Extrinsic Cues Cues external to the product (such as price, store image, or brand image) that serve to influence the consumer’s perception of a product’s quality.
Characteristics of Services • Intangible • Variable • Perishable • Simultaneously Produced and Consumed
Dimensions for Measuring Service Quality • DIMENSION DESCRIPTION • Tangibles Appearance of physical facilities, equipment, personnel, and communication materials • Reliability Ability to perform the promised service dependably and accurately • Responsiveness Willingness to help customers and provide prompt service • Assurance Knowledge and courtesy of employees and their ability to convey trust and confidence • Empathy Caring, individualized attention the firm provides its customers
A Conceptual Model of the Components of Transaction Satisfaction Evaluation of Service Quality (SQ) Evaluation of Product Quality (PQ) Transaction Satisfaction (TSAT) Evaluation of Price (P)
Conceptual Model of the Behavioral Consequences of Service Quality Behavioral Intentions Service Quality +$ Ongoing Revenue Increased Spending Price Premium Referred Customers Superior Favorable Remain Behavior Financial Consequences -$ Decreased Spending Lost Customers Costs to Attract New Customers Inferior Unfavorable Defect Focus of present study Empirical links demonstrated in macro studies
Price/Quality Relationship The perception of price as an indicator of product quality (e.g., the higher the price, the higher the perceived quality of the product).
Conceptual Model of the Effects of Price, Brand Name, and Store Name on Perceived Value Objective Price + + Perception of Price Perceived Quality Perceived Sacrifice Perceived Value - + - + Willingness to Buy A. Conceptual Relationship of Price Effect
Brand Name Store Name Objective Price + + Perception of Price Perception of Brand Perception of Store + Perceived Quality Perceived Sacrifice + - + Perceived Value - + B. Extended Conceptualization to Include Brand Name and Store Name Willingness to Buy
Perceived Risk The degree of uncertainty perceived by the consumer as to the consequences (outcome) of a specific purchase decision.
Types of Perceived Risk • Functional Risk • Physical Risk • Financial Risk • Psychological Risk • Time Risk
How Consumers Handle Risk • Seek Information • Stay Brand Loyal • Select by Brand Image • Rely on Store Image • Buy the Most Expensive Model • Seek Reassurance