Download
1 / 51
510 likes | 614 Views
Learn methods to solve systems of linear equations using substitution and elimination techniques, including matrices and determinants. Understand algebraic methods, matrix algebra, and solutions for non-linear equations.

E N D
12.1 Systems of Linear Equations: Substitution and Elimination
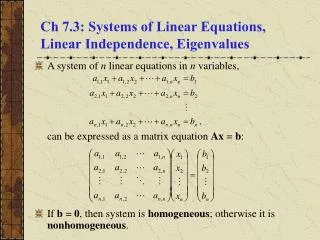
A system of equations is a collection of two or more equations, each containing one or more variables. A solution of a system of equations consists of values for the variables that reduce each equation of the system to a true statement. To solve a system of equations means to find all solutions of the system. When a system of equations has at least one solution, it is said to be consistent; otherwise it is called inconsistent.
An equation in n variables is said to be linear if it is equivalent to an equation of the form where are n distinct variables, are constants, and at least one of the a’s is not zero.
If each equation in a system of equations is linear, then we have a system of linear equations.
If the graph of the lines in a system of two linear equations in two variables intersect, then the system of equations has one solution, given by the point of intersection. The system is consistent and the equations are independent. y Solution x
If the graph of the lines in a system of two linear equations in two variables are parallel, then the system of equations has no solution, because the lines never intersect. The system is inconsistent. y x
If the graph of the lines in a system of two linear equations in two variables are coincident, then the system of equations has infinitely many solutions, represented by the totality of points on the line. The system is consistent and dependent. y x
Two Algebraic Methods for Solving a System 1. Method of substitution 2. Method of elimination
Use graphing utility to solve the previous system of equations (1) (2)
A system of three linear equations containing three variables has either • Exactly one solution (consistent system with independent equations). • No solution (inconsistent system). • Infinitely many solutions (consistent system with dependent equations).
(1) Solve: (2) (3)
A matrix is defined as a rectangular array of numbers, Column j Column n Column 1 Column 2 Row 1 Row 2 Row i Row 4
Row Operations on an Augmented Matrix 1. Interchange any two rows. 2. Replace a row by a nonzero multiple of that row. 3. Replace a row by the sum of that row and a constant multiple of some other row.
Write the augment matrix of the system. Perform operations that place the number 1 in row 1 column1. Perform operations that leave the entry 1 in row 1 and column1 unchanged, while causing 0’s appear below it in column1. Perform operations that place 1 in row 2 column 2, but leave the entries in columns to the left unchanged. The perform operations to place 0’s below it.(If rows that contain only 0’s are obtained place them to the bottom of the matrix.) Repeat previous step. Matrix Method for Solving a System of Linear Equations (Row Echelon Form)
Solve using a graphing utility.
If a, b, c, and d are four real numbers, the symbol is called a 2 by 2 determinant. Its value is ad-bc; that is
Theorem Cramer’s Rule The solution to the system of equations is given by D = ad-bc provided that
= =
Consider the two matrices: (a) Find A+B
(b) Find A-B. (c) Find 3A
Let A denote an m by r matrix and let B denote an r by n matrix. The productAB is defined as the m by n matrix whose entry in row i, column j is the product of the ith row of A and the jth column of B. The definition of the product AB of matrices A and B, in this order requires that the number of columns in A equal the number of rows of B. Otherwise the product is undefined. A m by r B r by n Must be same for AB to exist. AB is m by n.
Associative Property A(BC)=(AB)C Distributive Property A(B+C)=AB+AC Commutative Property Matrix multiplication is not commutative.
Identity Property If A is an m by n matrix, then Im A = Aand AIn= A
Let A be a square n by n matrix. If there exists an n by n matrix A-1, read “A inverse”, for which Then A-1 is called the inverse of the matrix A.
Procedure for Finding the Inverse of a Nonsingular Matrix • Form the matrix [A|In]. • Transform the matrix [A|In] into reduced row echelon form. • The reduced row echelon of [A|In] form will contain the identity matrix In on the left of the vertical bar; the n by n matrix on the right of the vertical bar is the inverse of A.
Two algebraic methods for solving systems of equations 1. Substitution 2. Elimination
Solve by substitution (1) (2)
2x - y -8 > 0 Test point: (1, 3) Does not belong to graph 2(1) - 3 - 8 = -9 < 0 Test point: (5, 1) Belongs to graph 2(5) - 1 - 8 = 1 > 0
Steps for Graphing an Inequality by Hand • Replace the inequality symbol by an equal sign and graph the resulting equation. If the inequality is strict, use dashes; otherwise use solid mark. This graph separates the xy-plane into two regions. • Select a test point P in one of the regions. • If the coordinates of P satisfy the inequality, then so do all the points in that region. Shade that region. • If the coordinates of P do not satisfy the inequality, then none of the points in that region do. Shade the opposite region.
Steps for Graphing an Inequality Using a Graphing Utility • Replace the inequality symbol by an equal sign and graph the resulting equation. This graph separates the xy-plane into two regions. • Select a test point P in one of the regions. • Use graphing utility to check if P satisfy the inequality. If it does then so do all the points in that region. Use graphing utility to shade that region. • If the coordinates of P do not satisfy the inequality, then none of the points in that region do. Shade the opposite region.
y = x - 6 y = -2x + 5