Download

1 / 16
160 likes | 291 Views
Box and Whisker Plot . Tina Walters 2008. Box and Whisker. 50, 80, 22, 64, 56, 14, 39, 45, 84, 27 . Create a Box and Whisker Plot for this set of data. Box and Whisker. 50, 80, 22, 64, 56, 14, 39, 45, 84, 27 . 1. Put numbers in order from least to greatest. Box and Whisker.

E N D
Box and Whisker Plot Tina Walters 2008
Box and Whisker 50, 80, 22, 64, 56, 14, 39, 45, 84, 27 Create a Box and Whisker Plot for this set of data.
Box and Whisker 50, 80, 22, 64, 56, 14, 39, 45, 84, 27 1. Put numbers in order from least to greatest.
Box and Whisker 50, 80, 22, 64, 56, 14, 39, 45, 84, 27 14, 22, 39, 45, 50, 56, 64, 80, 84 • Put numbers in order from least to greatest. • Identify the extremes (highest and lowest numbers).
Box and Whisker 50, 80, 22, 64, 56, 14, 39, 45, 84, 27 14, 22, 39, 45, 50, 56, 64, 80, 84 • Put numbers in order from least to greatest. • Identify the extremes (highest and lowest numbers). 14 Lower Extreme 84 Upper Extreme
Box and Whisker 50, 80, 22, 64, 56, 14, 39, 45, 84, 27 14, 22, 39, 45, 50, 56, 64, 80, 84 • Put numbers in order from least to greatest. • Identify the extremes (highest and lowest numbers). 14 Lower Extreme 84 Upper Extreme 3. Make a number line for the set of numbers.
Box and Whisker 50, 80, 22, 64, 56, 14, 39, 45, 84, 27 14, 22, 39, 45, 50, 56, 64, 80, 84 • Put numbers in order from least to greatest. • Identify the extremes (highest and lowest numbers). 14 Lower Extreme 84 Upper Extreme • Make a number line for the set of numbers. • Plot the Upper and Lower Extremes. 10 90
Box and Whisker 50, 80, 22, 64, 56, 14, 39, 45, 84, 27 14, 22, 39, 45, 50, 56, 64, 80, 84 • Put numbers in order from least to greatest. • Identify the extremes (highest and lowest numbers). 14 Lower Extreme 84 Upper Extreme • Make a number line for the set of numbers. • Plot the Upper and Lower Extremes. 10 90 14 84
Box and Whisker 50, 80, 22, 64, 56, 14, 39, 45, 84, 27 14, 22, 39, 45, 50, 56, 64, 80, 84 • Put numbers in order from least to greatest. • Identify the extremes (highest and lowest numbers). 14 Lower Extreme 84 Upper Extreme • Make a number line for the set of numbers. • Plot the Upper and Lower Extremes. • Find the median of the data and plot below the number line. 10 90 14 84
Box and Whisker 50, 80, 22, 64, 56, 14, 39, 45, 84, 27 14, 22, 39, 45, 50, 56, 64, 80, 84 • Put numbers in order from least to greatest. • Identify the extremes (highest and lowest numbers). 14 Lower Extreme 84 Upper Extreme • Make a number line for the set of numbers. • Plot the Upper and Lower Extremes. • Find the median of the data and plot below the number line. 10 90 14 47.5 84
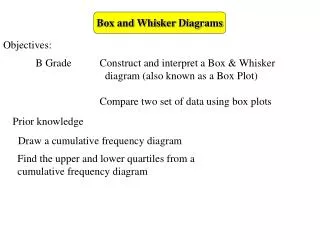
Box and Whisker 50, 80, 22, 64, 56, 14, 39, 45, 84, 27 14, 22, 39, 45, 50, 56, 64, 80, 84 • Put numbers in order from least to greatest. • Identify the extremes (highest and lowest numbers). 14 Lower Extreme 84 Upper Extreme • Make a number line for the set of numbers. • Plot the Upper and Lower Extremes. • Find the median of the data and plot below the number line. • Find the median of the upper half and the lower half. Plot below the number line. This is called the Upper and Lower Quartiles. 10 90 14 47.5 84
Box and Whisker 50, 80, 22, 64, 56, 14, 39, 45, 84, 27 14, 22, 39, 45, 50, 56, 64, 80, 84 • Put numbers in order from least to greatest. • Identify the extremes (highest and lowest numbers). 14 Lower Extreme 84 Upper Extreme • Make a number line for the set of numbers. • Plot the Upper and Lower Extremes. • Find the median of the data and plot below the number line. • Find the median of the upper half and the lower half. This is called the Upper and Lower Quartiles. Plot below the number line. 10 90 14 27 47.5 64 84
Box and Whisker 50, 80, 22, 64, 56, 14, 39, 45, 84, 27 14, 22, 39, 45, 50, 56, 64, 80, 84 • Put numbers in order from least to greatest. • Identify the extremes (highest and lowest numbers). 14 Lower Extreme 84 Upper Extreme • Make a number line for the set of numbers. • Plot the Upper and Lower Extremes. • Find the median of the data and plot below the number line. • Find the median of the upper half and the lower half. Plot below the number line. This is the Upper and Lower Quartile. 10 90 14 27 47.5 64 84
Box and Whisker Put numbers in order from least to greatest. Identify the extremes (highest and lowest numbers). 14 Lower Extreme 84 Upper Extreme Make a number line for the set of numbers. Plot the Upper and Lower Extremes. Find the median of the data and plot below the number line. Find the median of the upper half and the lower half. Plot below the number line. Draw a box from Upper Quartile to Lower Quartile. 10 90 14 27 47.5 64 84
Box and Whisker Put numbers in order from least to greatest. Identify the extremes (highest and lowest numbers). 14 Lower Extreme 84 Upper Extreme Make a number line for the set of numbers. Plot the Upper and Lower Extremes. Find the median of the data and plot below the number line. Find the median of the upper half and the lower half. Plot below the number line. Draw a box from Upper Quartile to Lower Quartile. Draw lines from the Quartiles to the Extremes. 10 90 14 27 47.5 64 84
Box and Whisker Put numbers in order from least to greatest. Identify the extremes (highest and lowest numbers). 14 Lower Extreme 84 Upper Extreme Make a number line for the set of numbers. Plot the Upper and Lower Extremes. Find the median of the data and plot below the number line. Find the median of the upper half and the lower half. Plot below the number line. Draw a box from Upper Quartile to Lower Quartile. Draw lines from the Quartiles to the Extremes. 10 90 14 27 47.5 64 84