Download
1 / 33
330 likes | 455 Views
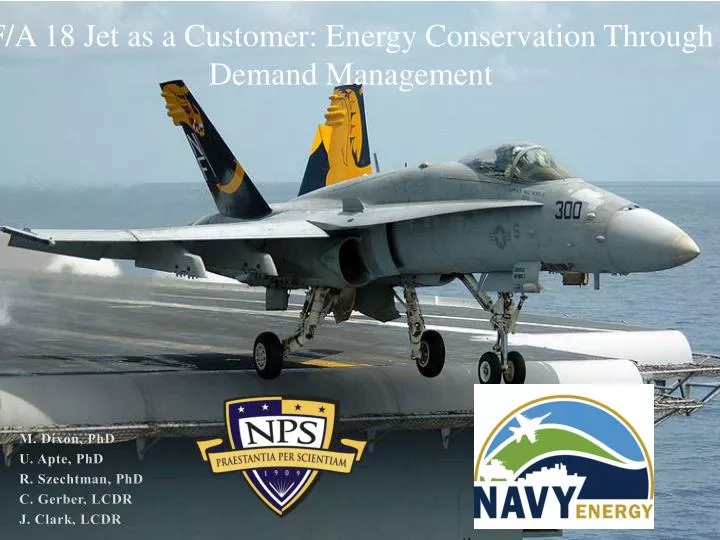
F/A 18 Jet as a Customer: Energy Conservation Through Demand Management. M. Dixon, PhD U. Apte , PhD R. Szechtman , PhD C. Gerber, LCDR J. Clark, LCDR. Background. Fiscal austerity throughout the Defense Department

E N D
F/A 18 Jet as a Customer: Energy Conservation Through Demand Management M. Dixon, PhD U. Apte, PhD R. Szechtman, PhD C. Gerber, LCDR J. Clark, LCDR
Background • Fiscal austerity throughout the Defense Department • Sequestration projects an annual shortfall of $55B per year through 2021 • Annual Navy budget reduction is $10-15B (~7.8%) per year • Energy management is now an operational and strategic imperative • Navy Task Force Energy established the Aviation Working Group to research and propose energy policies. Reduce fuel consumption without impacting combat readiness, tactical proficiency, or safety
Naval Aviation Enterprise “We are operating in challenging fiscal and operational times, and we must take appropriate action now to ensure the current and future vitality of Naval Aviation. To successfully achieve our missions today and in the future, all Naval Aviation stakeholders must be in sync and focused on the common goals of advancing readiness while reducing costs.” Vice Admiral David Buss Commander, Naval Air Forces Commander, Naval Air Force, U.S. Pacific Fleet April 2013
Energy Consumption • In 2010, the US burned 7.1B barrels of fuel, roughly 25% of the world demand. US Gov’t represents 2% of this. • For every $1 rise in the price of petroleum, the Navy’s fuel bill increases by $31M per year Primary focus is to reduce non-mission fuel burn. A 4% reduction is equivalent to 21 million gallons, or roughly $85M per year.
Naval Aviation Fuel Use • Annual fuel consumption in the Navy is nearly 600M gallons 55% of all Naval Aviation jet fuel is consumed by the F/A-18 Hornet
F/A 18 as a Customer • Time • Aircraft maintenance costs $100 per minute • Fuel burn costs $13 per minute (3.4 gpm) • Aircraft Fuel Capacity • F/A-18C/D Hornet 1,800 gal • F/A-18E/F Super Hornet 2,500 gal (28% larger)
Service System – Ground Operations Two Refueling Methods Hot Skids: Engines online Fuel Trucks: Engines offline
How is running a Naval Airfield like running a restaurant? • Hungry customers want food • Customers all want to eat at the same time • Customers take different amount of time dining • Hungry airplanes want fuel • Pilots all want to land at the same time • Planes take different amount of time refueling
What problems do Naval Airfields and restaurants share? Queuing at high demand periods
What problems do Naval Airfields and restaurants share? Excess capacity at low demand periods
Demand Management Strategies Shift demand to other periods
Managing Demand through Arrival Slots Goal: create a arrival policy that reduces high-demand peaks: • No decrease in flights flown • Question: what are the benefits of a “reservation” arrival policy? • wait time • fuel burned
Discrete Event Simulation Complexity • Input from 2,600 flights in August 2012 • Avg of 107 flights per day (0800-1759) • 2 runways, 5 hangars, 16 squadrons • Multiple post flight processes Metrics • Captured fuel consumed (gallons) & time from touchdown to shutdown (or launch) • Experiments manipulated arrival patterns and ground turnaround time Simio Simulation Software • Commercial suite • Assumed 250 annual fly days • One replication = One 10-hour fly day representing ops between 0800-1759
Managing Demand through Arrival Slots Worst Case s = 11 Most Likely s = 7 Recommendation s = 4
Slot Management Results 42K gallon Savings
Slot Management Results $1.2 million Savings
Slot Management Results Decrease of 36 seconds on average
Demand Management Strategies Manage customers expectation for meal duration
Ground Turnaround (GT) Time Time between flights is scheduled a priori Ground turnarounds of less than 60 minute requires hot skid refueling Airborne Airborne Hot Skid = Engines On = Burned Fuel = Bad GT < 60 mins Hot Skid GT > 60 mins Truck Refuel Wave 1 Takeoff Wave 1 Landing Wave 2 Takeoff Wave 2 Landing
Ground Turnaround (GT) Time • Data showed 37% of all ground turnarounds were less than 60m • Only one F/A-18 mission required ground turnaround less than 60m • Field Carrier Landing Practice (6.5%) • We developed a few incremental options for the decision maker at 20%, 10%, and FCLP Only • Question: what are the benefits of restricting customer’s choices?
Ground Turnaround Results 188K gallon Savings
Ground Turnaround Results $6.0 million Savings
Ground Turnaround Results Shaved over 2 minutes!
Demand Management Strategies Attract the right customers Or Know your customers
Transition Impacts to Fuel Consumption • Over next 2 years, remaining legacy F/A-18’s transition to the newer F/A-18EF Super Hornet • We compare current ground operations to those anticipate in 2016. • F/A-18C/D Hornet 1,800 gal • F/A-18E/F Super Hornet 2,500 gal (28% larger) • Question: what happens when all our customers are hungrier?
Potential Impact Across All Naval Aviation • Assuming every flight successfully shaves 2 minutes from their post-flight ground processes… $23.0M and 785K gallons avoided across all Naval Aviation
Key Takeaways • Decrease variation in aircraft arrivals during peak periods by establishing a culture of squadron collaboration at the type-wing level through slot management • Promulgate a flight scheduling policy restricting ground turnaround time less than or equal to 60 minutes to 10 percent of all missions planned • Traditional Demand Management techniques can be applied to conserve energy in complex service systems
More Fight – Less Fuel:Reducing Fuel Burn through Ground Process Improvement QUESTIONS / COMMENTS M. Dixon, PhD U. Apte, PhD R. Szechtman, PhD C. Gerber, LCDR J. Clark, LCDR