Download
1 / 36
360 likes | 515 Views
Do you believe in fairy tales?. Yes No. Upcoming work. Part 3 of Data Project due today Quiz #5 in class this Thursday HW #10 due Sunday. Chapter 22. Comparing Two Proportions. Comparing Two Proportions.

E N D
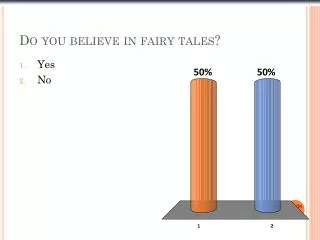
Do you believe in fairy tales? • Yes • No
Upcoming work • Part 3 of Data Project due today • Quiz #5 in class this Thursday • HW #10 due Sunday
Chapter 22 Comparing Two Proportions
Comparing Two Proportions • Comparisons between two percentages are much more common than questions about isolated percentages. And they are more interesting. • We often want to know how two groups differ, • a treatment is better than a placebo control, • this year’s results are better than last year’s. • Team A is better than Team B
Examples • Compare the survival rate from cancer for those that use traditional medicine treatments to the survival rate from cancer for those that use alternative treatment methods. • Compare the percentage of white adults that smoke to the percentage of black adults that smoke. • Compare the proportion of women who have an abortion that need mental health treatment to the proportion of women who have a small infant that need mental health treatment.
The hypothesis • The typical hypothesis test for the difference in two proportions is the one of no difference. In symbols, H0: p1 – p2 = 0. • The alternatives: • Ha: p1 –p2 > 0 • Ha: p1 –p2 < 0 • Ha: p1 –p2 ≠ 0
Provided that the sampled values are independent, the samples are independent, and the samples sizes are large enough, the sampling distribution of is modeled by a Normal model with Mean: Standard deviation: The Sampling Distribution - Theory
When the conditions are met, we are ready to find the confidence interval for the difference of two proportions: The confidence interval is where The critical value z* depends on the particular confidence level, C, that you specify. SE for Confidence Intervals
Problem • Company X invents a new drug called NoZits that they believe cures acne problems. • To see if NoZits works they run a test. They have 100 people (Group A) wash their face with NoZits, and 120 people (Group B) wash their face with the other leading brand. • Group A – 45 people’s skin clears up the next day • Group B – 52 people’s skin clears up the next day • Create a 95% confidence interval for the difference between the two groups.
What does pA represent? • The proportion of people with better skin. • The proportion of people with better skin who used NoZits. • The proportion of people with better skin who used the leading brand.
Company X hopes to show that NoZits is a better drug than the leading brand. What hypotheses test should it run? • Ho: pA = pB Ha: pA ≠ pB • Ho: pA = pB Ha: pA < pB • Ho: pA = pB Ha: pA > pB
Critical Z* and significance level two-sided • α= .20 CI = 80% z*=1.282 • α= .10 CI = 90% z*=1.645 • α= .05 CI = 95% z*=1.96 • α= .02 CI = 98%z*=2.326 • α= .01 CI = 99% z*=2.576
Interpretation of a confidence interval • We are 95% confidence that the true difference between the two test groups falls within • (-0.11172, 0.15172) • Or • (-11.17%, 15.17%) • Our data fail to reject the null hypothesis. We do NOT have enough evidence to suggest a difference between success rates. • NoZits is NOT better at getting rid of acne
Estimates for the SD • Confidence Intervals • Use each groups individual success rate to calculate the SE • P-value and Z* testing • Use pooled proportion to calculate the SE
We use the pooled value to estimate the standard error: Now we find the test statistic: When the conditions are met and the null hypothesis is true, this statistic follows the standard Normal model, so we can use that model to obtain a P-value. SE for p-value and Z* hypothesis testing
The pooled proportion is where and If the numbers of successes are not whole numbers, round them first. (This is the only time you should round values in the middle of a calculation.) Calculating the Pooled Proportion
Homework Problem • A clinic reported the following statistics • For women under the age of 38 • 47 live births to 165 women • For women over the age of 38 • 4 live births to 78 women • Is there a difference in the effectiveness of the clinic’s methods for older women? • Use a both a z* test and a 95% confidence interval to test your hypothesis
What does p1 represent? • The proportion of live births • The proportion of women over 38 with live births • The proportion of women under 38 with live births
Is there evidence of a difference between the two groups? • Ho: p1 = p2 Ha: p1 ≠ p2 • Ho: p1 = p2 Ha: p1 < p2 • Ho: p1 = p2 Ha: p1 > p2
What is our test ‘rule’? • If z > critical z* , then reject null hypothesis. • If z > critical z* , then accept null hypothesis. • If z < critical z* , then reject null hypothesis. • If z > critical z* , then accept null hypothesis.
What is the result of this hypothesis test at a significance level of 0.05? • Do not reject the null hypothesis b/c there IS NOT sufficient evidence to make the claim of a difference • Accept the alternative hypothesis b/c there IS sufficient evidence to support claim of a difference • Reject the null hypothesis b/c there IS sufficient evidence to support the claim of a difference
Would we get a different result with a CI? • Let’s calculate the CI at 95%
Our CI (14.9%, 31.7%). How would we interpret this CI? • There is 95% confidence the prop. of live births for clients of this clinic is greater for women under 38 • There is 95% confidence the prop. of live births is greater for women under 38 • There is 95% confidence the prop. of live births for a sample of clients of this clinic is greater for women under 38
Homework Problem • A survey of older Americans reveals, • 420 out of 1002 men suffer from arthritis • 543 out of 1070 women suffer from arthritis • Create a 95% CI to test the hypothesis that the proportion of adults suffering from arthritis is greater for women than for men.
Does this suggest that arthritis is more likely to afflict women than men? • No. No conclusion can be made based on the confidence interval. • No. The interval is too close to 0. • Yes. The entire interval lies above 0. • Yes, we are 95% confident, based on these samples, that about 13.1% of senior women suffer from arthritis, while only 4.6% of senior men suffer from arthritis.
HW - Problem 8 • One country reported • 84 out of 3157 white women had multiple births • 20 out of 625 black women had multiple births • Does this indicate any racial difference of the likelihood of multiple births?
Defining the proportions affects the hypothesis • P1 = proportion of multiple births from white women • P2 = proportion of multiple births from black women
Does this indicate any racial difference? • Ho: p1 – p2 =0 Ha: p1 – p2>0 • Ho: p1 – p2 =0 Ha: p1 – p2<0 • Ho: p1 – p2 =0 Ha: p1 – p2≠0
Do white women typically have more multiple births? • Ho: p1 – p2 =0 Ha: p1 – p2>0 • Ho: p1 – p2 =0 Ha: p1 – p2<0 • Ho: p1 – p2 =0 Ha: p1 – p2≠0
Do black women typically have more multiple births? • Ho: p1 – p2 =0 Ha: p1 – p2>0 • Ho: p1 – p2 =0 Ha: p1 – p2<0 • Ho: p1 – p2 =0 Ha: p1 – p2≠0
Suppose our question is ‘is there a difference between blacks and white?’What is our test ‘rule’? • If z > critical z* , then reject null hypothesis. • If z > critical z* , then accept null hypothesis. • If z < critical z* , then reject null hypothesis. • If z > critical z* , then accept null hypothesis.
What level of significance do you want to choose ? • α= .20 z*=1.282 • α= .10 z*=1.645 • α= .05 z*=1.96 • α= .02 z*=2.326 • α= .01 z*=2.576
What is the result of the hypothesis test? • Reject the null hypothesis b/c there is sufficient evidence to support the claim of a difference. • Do not reject the null hypothesis b/c there is NOT sufficient evidence to support the claim of a difference • Accept the null hypothesis b/c there is NOT sufficient evidence to support the claim of a difference
Errors • Type 1 Error – Rejecting when Null is True • Type 2 Error - Failing to Reject when the Null is False
Suppose our last test was incorrect, what type of error did we make? • Type 1 • Type 2 • This cannot be determined
Coming Up… • Quiz #5 on Thursday.