Download
1 / 1
10 likes | 95 Views
Learn how combining Directory-Listed & Cellphone samples affects survey coverage, cost efficiency, & noncoverage bias in local studies, emphasizing the benefits of using the EWP+Cell design over RDD+Cell.

E N D
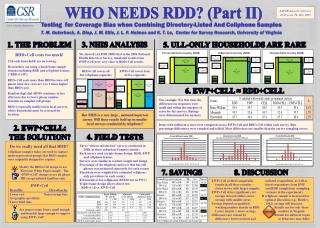
Testing for Coverage Bias when Combining Directory-Listed And Cellphone Samples T. M. Guterbock, A. Diop, J. M. Ellis, J. L. P. Holmes and K. T. Le, Center for Survey Research, University of Virginia AAPOR Annual Conference Hollywood, FL, May 2009 WHO NEEDS RDD? (Part II) www.virginia.edu/surveys 3. NHIS ANALYSIS 1. THE PROBLEM 5. ULL-ONLY HOUSEHOLDS ARE RARE • RDD+Cell costs too much! • Cell-only households are increasing. • Researchers are using a dual-frame sample design combining RDD and cell phone frames (“RDD+Cell”). • RDD+Cell costs more than RDD because cell phone interview costs are 2 to 3 times higher than RDD costs. • Random digit dial (RDD) continues to lose efficiency due to lower phone number densities in sampled call groups. • RDD is especially inefficient in local surveys, where households must be screened for location. We showed (AAPOR 2008) that in the 2006 National Health Interview Survey, simulated results from EWP+Cell were very close to RDD+Cell results. RDD+Cell covers all five telephone segments EWP+Cell covers four of five segments 6. EWP+CELL ≈ RDD+CELL One example: For this item, the differences in responses were small and within the margins of error for the surveys. Ratings were dichotomized for analysis. But NHIS is a very large , national in-person survey. Will these results hold up in smaller local surveys conducted by telephone? Items with sufficient n sizes were compared across EWP+Cell and RDD+Cell within each survey. Raw percentage differences were rounded and tallied. Most differences are smaller than the survey sampling errors. 2. EWP+CELL: THE SOLUTION? 4. FIELD TESTS • Do we really need all that RDD? • Cellphone samples today are used to capture underrepresented groups that RDD samples were originally designed to capture. • Modify the RDD+Cell design to use Electonic White Pages sample. The “EWP+Cell” design covers all phone HH except unlisted landline-only. • EWP+Cell • Benefits Drawbacks • Lower cost Noncoverage bias • Geographic specificity • Faster field time • Are noncoverage biases small enough and benefits large enough to support using EWP+Cell? • Three “citizen satisfaction” surveys conducted in 2008, in three suburban Virginia counties • Each survey used a triple-frame design: RDD, EWP and cellphone frames • Surveys were similar in content, length and design • Percentage of the telephone universe that has cell phones was estimated separately for each county • Final data were weighted for estimated cellphone-only prevalence in each county • $10 incentives for cellphones ($5/$10 test in PWC) • Triple frame design allows direct test: • RDD+Cell vs. EWP+Cell 8. DISCUSSION 7. SAVINGS EWP+Cell yielded comparable results in all three counties – closer in two with larger samples. EWP+Cell offers significant cost savings in local studies, more savings with smaller areas. Savings depend on qualified, working number density in RDD. Lower density = more savings. Differences are caused by differences between listed and unlisted respondents, as well as listed respondents from EWP and RDD completions (sampling variance in the experiment). If cellphone sample is increased for optimal allocation (e.g., Hartley, 1962), savings will decrease. Results are for only three counties in Virginia. Results for different topics or behaviors may differ. “CPH” = Completions per hour