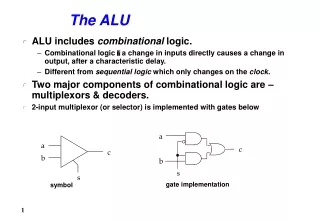
ALU Software
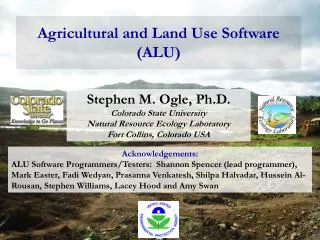
ALU Software . Stephen M. Ogle, Ph.D . Research Scientist and Associate Professor Colorado State University Natural Resource Ecology Laboratory Fort Collins, Colorado USA. ALU Software Scope & Design. Primary Purpose: support reporting of GHG emissions to the UNFCCC


ALU Software
E N D
Presentation Transcript
ALU Software Stephen M. Ogle, Ph.D. Research Scientist and Associate Professor Colorado State University Natural Resource Ecology Laboratory Fort Collins, Colorado USA
ALU Software Scope & Design • Primary Purpose: support reporting of GHG emissions to the UNFCCC • GHG Inventory Software Program • Developed for LULUCF and Agriculture Sectors • Based on IPCC methods (1996 GL and 2000-2003 GPG) • Emphasis on incorporation of good practices • Accommodates IPCC Tier 1 methods but allows compilers to advance inventory with the Tier 2 method capability • User-interface guiding compiler through inventory process of data entry and calculations
Reporting • Ultimate goal of a national GHG inventory is to report emissions to the UNFCCC • Reporting is generally done in spreadsheets • Maps can be useful for illustrating variation in emissions across a country • Goals: • provide emission reports that conform to the norm for NAI party reporting (i.e.,spreadsheet) • facilitate the development of emission maps to the extent that activity data and/or emission factors vary spatially
Data Management • Agriculture and LULUCF require considerable data • Relational database structure with efficient storage of data • Goals: • assign emission factors automatically to activity data • relate activity data and emission factors directly to calculations
Tier 1 and Tier 2 Methods • Tier 1 is acceptable for reporting but default emission factors can lead to significant biases • Tier 2 is encouraged for key categories • Limited strata for assigning Tier 2 factors in spreadsheets • Goals: • facilitate application of Tier 2 methods from activity data compilation to assignment factors • provide more opportunity for stratifying the land base or livestock population
Quality Assurance/Quality Control • Important step which often uncovers errors by compiler • Also can allow input of third parties who may have knowledge of other data relevant for the inventory • Goal: provide an utility that facilitates QA/QC • Interface displays data which can be validated as QA/QC is completed • Export QA/QC data for ease of distribution for review
Uncertainty Estimation • Inventories following good practice “contain neither over- nor under-estimates so far as can be judged, and which uncertainties are reduced as far as is practicable” (IPCC GPG 2000) • Difficult to evaluate if uncertainty is not estimated • Uncertainty is sometimes an after-thought for compilers • Goal: encourage the compilation of uncertainty data with the activity data collection and development of Tier 2 emission factors
Document Inventory & Archive • Institutional memory requires documentation • Data archive is needed to ensure data are maintained • With back-ups • Goal: • provide a utility that facilitates documentation • Note pad that can be exported • Documentation boxes for Tier 2 factors • make archiving easier for the compiler
Some other issues • Consistency in time series: encourage the recalculation and consistent application of methods across a time series • Complete land representation: facilitate use of remote sensing-based products to achieve a complete representation of managed land base • Enhanced livestock characterization: facilitate use of remote sensing-based products to achieve a complete representation of managed land base • Mitigation analysis: facilitate mitigation analysis using the inventory as the baseline
Module I: Activity data entry Module III: Complete Emission Calculations Module II: Assign Emission Factors
Select Climate Region Enter enhanced animal population numbers Total Enter basic animal population numbers
Select Climate and Livestock Categories Enter Populations Enter Population Totals
Select Climate Livestock Category and Population Select Subcategory Enter Subcategory Totals
Select Manure Management Systems Select Basic and Enhanced Categories Enter % of manure management system
Factors/Data needed to estimate gross energy intake Available factor files
Factors needed to estimate enteric methane emissions Available factor files Additional options
Equation and Legend Calculation Review results for enteric methane emissions
Equation and Legend Calculation Review results for enteric methane emissions
Scope of Analysis • Analyze the potential change in greenhouse gas emissions from changing management of land and livestock • Use existing inventory in ALU as the baseline • Include multiple source categories influenced by practice • Within Agricultural and Land Use, Land Use Change and Forestry sectors • Biophysical potentials produced by ALU, but projections can be informed by economic forecasts of commodity production and consequences for management of land and livestock
Approaches for Mitigation Analysis • Whole Session Approach • Focus on all practices • Maximum utility • Assesses all drivers of emissions and mitigation potential • i.e., Population growth, economic growth and technology • Practice-Based Approach • Focus on specific practice • Focuses on technology as a driver of emissions and mitigation potential
Select baseline type Select baseline session
Data Entry Flow • Data is entered in a specific sequence • Building on the previous data entry in each step • Pre-requisite data entry • System is locked until session is initiated • Each step will open another part of system as valid data are entered • Data do not have to be complete but must be valid • Prevents errors
Validation Checks • Validation checks after each step • Ensure internal data integrity • Identifies steps that are not complete or influenced by a change in data • Types of errors • Missing data • Inappropriate characters • Inappropriate data • Invalid land areas • Invalid livestock totals • Invalid lime or N fertilizer totals
Validation Checks • Program System Flags • “+” means that data entry passed the validation • “-” means that data entry has not passed validation • Program system will reset flags if you make changes in the data • Session flags can be viewed by clicking the “Session Status” button on main window of program
ALU software Free download from: www.nrel.colostate.edu/projects/ghgtool/software.php