### Variability of Sea Level in the Solomon Sea: Insights from Altimetric Data Analysis ###
This study explores the variability of sea level in the Solomon Sea using altimetric data. The region is characterized by high sea level anomaly (SLA) variability primarily influenced by ENSO events and seasonal changes. By employing a novel method to analyze SLA specifically in the Solomon Sea, the research identifies significant interannual and seasonal patterns. The findings reveal stronger variability in the eastern part of the sea, influenced by complex recirculation dynamics, and highlight the correlation between the sea level in the Solomon Sea and surrounding regions, including the New Guinea Coastal Undercurrent. ###

### Variability of Sea Level in the Solomon Sea: Insights from Altimetric Data Analysis ###
E N D
Presentation Transcript
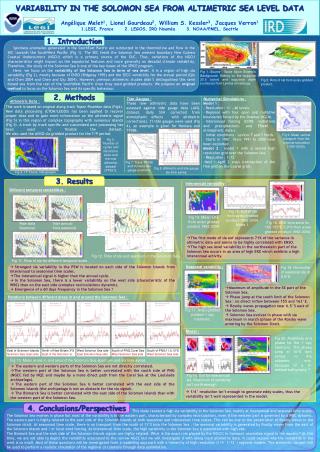
VARIABILITY IN THE SOLOMON SEA FROM ALTIMETRIC SEA LEVEL DATA • Angélique Melet1,Lionel Gourdeau2, William S. Kessler3, Jacques Verron1 • LEGI, France 2. LEGOS, IRD Nouméa 3. NOAA/PMEL, Seattle 1. Introduction Spiciness anomalies generated in the SouthEast Pacific are subducted in the thermocline and flow in the SEC towards the SouthWest Pacific (Fig 1). The SEC feeds the Solomon Sea western boundary New Guinea Coastal Undercurrent (NGCU) which is a primary source of the EUC. Thus, variations of the NGCU characteristics might impact on the equatorial features and more generally on decadal climate variability. Therefore, the study of the Solomon Sea is one of the key issues of the SPICE program. Here, we focus on the variability of the Solomon Sea in term of sea level. It is a region of high sla variability (Fig 2), mostly because of ENSO (Ridgway 1993) and the SECC variability for the annual period (Qiu and Chen 2004 and Chen and Qiu 2004). However, previous altimetric studies didn’t distinguished this semi closed sea from the rest of the SouthWest Pacific since they used gridded products. We propose an original method to focus on the Solomon Sea and its specific behaviour. Fig 1. Source : Spice Spice Scientific Background. Salinity on the isopycnal 25.5 (color) and isopycnal depth (contours) from Levitus climatology. Fig 2. Rms of sla from aviso gridded product. 2. Methods Fig 9. Mean vertical transport from the regional simulation (1991-2000). Fig 5. Number of cycles and sla rms for aviso and the new altimetric dataset (TP251). Fig 7. Track TP086 and Honiara tide gauge positions. Fig 8. Altimetric and tide gauge sla time series. Fig 4. TP tracks, tide gauges. 3. Results Interannual variability : Different temporal variabilities : Fig 15. Eof of sla from aviso gridded product 1992-2004. Mode 1. Fig 14. Mean EKE from aviso gridded product 1992-2004. Fig 16. EKE time serie for 150:155°E 5:9°S from aviso gridded product 1992-2004. Raw data Inter annual Seasonal Intra seasonal • The first mode of sla eof represents 71% of the variance in altimetric data and seems to be highly correlated with ENSO. • The high sea level variability in the northeastern part of the Solomon Sea occurs in an area of high EKE which exhibits a high interannual activity. Fig 12. Rms of sla and spectrum in the Solomon Sea. Fig 11. Rms of sla for different temporal scale. • Strongest sla variability in the PSW is located on each side of the Solomon Islands from Interannual to seasonnal time scales. • The interannual signal is higher than the annual cycle. • In the Solomon Sea, there is a lower variability on the west side (characteristic of the WBC) than on the east side (complex recirculations dynamic). • Emergence of a 60 days frequency in the Solomon Sea ? Seasonal variability : Fig 18. Hovmuller of seasonal sla at 6.5°S. • Maximum of amplitude in the SE part of the Solomon Sea. • Phase jump at the south limit of the Solomon Sea : no direct inflow between 155 and 163°E. • Rossby waves propagation near 6.5°S east of the Solomon Sea. • Solomon Sea evolves in phase with sla maximum in march (phase of the Rossby wave entering by the Solomon Strait. Relations between different areas in and around the Solomon Sea : Fig 17. Aviso gridded product 1 cpy harmonic. Model : Fig 20. Amplitude and phase for the 1 cpy harmonic. The phase jump at 10°S isn’t similar to the altimetric one, because of a ill-defined bathymetry ? East of Solomon Islands Solomon Sea, East side North of New Britain 3°S East of the Solomon Is. West Solomon Sea side East Solomon Sea side South of PNG,Coral Sea West Solomon Sea side South of PNG:11.5,13°S West Solomon Sea side Fig 13. Mean areas in and around the Solomon Sea spectrum and sla time series. • The eastern and western parts of the Solomon Sea are not directly correlated. • The western part of the Solomon Sea is better correlated with the south side of PNG (NGCC fed by NQC and maybe by a more direct path from the Coral Sea at the Louisiade archipelago). • The eastern part of the Solomon Sea is better correlated with the east side of the Solomon Islands (the archipelago is not an obstacle for the sla signal). • The Bismarck Sea is better correlated with the east side of the Solomon Islands than with the western part of the Solomon Sea. Fig 19. Eof for interannual sla. Maximum of variability isn’t north enough. • 1/4° resolution isn’t enough to generate eddy scales, thus the variability isn’t well represented in the model. 4. Conclusions/Perspectives This study reveals a high sla variability in the Solomon Sea, mainly at interannual and seasonal time scales. The Solomon Sea evolves in phase but most of the variability is in the eastern part, characterized by complex recirculations, even if the western part is governed by a WBC dynamic. The eastern part is highly related to the east side of the Solomon islands at both seasonnal and interannual time scales. This can be due to the penetration of Rossby waves in the Solomon strait. At seasonnal time scale, there is no transport from the south of 11°S into the Solomon Sea : the seasonal variability is generated by Rossby waves from the east of the Solomon Islands and / or local wind forcing. At interannual time scale, the high variability in the Solomon Sea is associated with high eke. The Bismark Sea and the east side of the Solomon Islands signals are highly related. What is the exact role played by the NGCC to transport anomalies signal to the equator? At this time, we are not able to depict the variability associated to the narrow NGCC but we will investigate it with along track altimetric data. It could explain why the variability in the west is so small. Most of these questions will be investigated from a modelling approach with a hierarchy of high resolution (1/4° 1/12°) regional models. The altimetric dataset will be used to perform a realistic simulation of the regional circulations through data assimilation.