1. Introduction
Chandra Observation log. Obs Name Coordinates Exporsure l [deg] b [deg] [ksec] Sgr A* 359.94 -0.05 48.7 Sgr B2 0.59 -0.02 99.0 GCS13 0.00 -0.20 11.8 GCS14 0.00 0.00 10.8 GCS16 359.80 -0.20 11.8

1. Introduction
E N D
Presentation Transcript
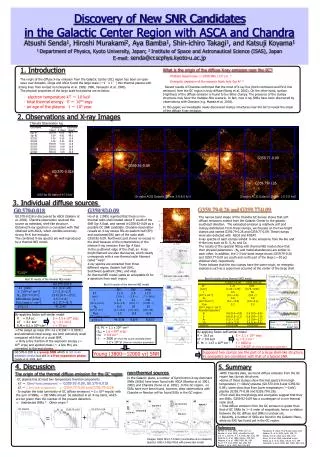
Chandra Observation log Obs Name Coordinates Exporsure l [deg] b [deg] [ksec] Sgr A* 359.94 -0.05 48.7 Sgr B2 0.59 -0.02 99.0 GCS13 0.00 -0.20 11.8 GCS14 0.00 0.00 10.8 GCS16 359.80 -0.20 11.8 GCS17 359.80 0.00 10.8 GCS19 359.61 -0.20 10.8 GCS20 359.61 0.00 10.8 15“~0.6 pc 1. Introduction What is the origin of the diffuse X-ray emission near the GC? ・Multiple Supernovae (~1000 SNe / 105 yr)? ・Energetic explosion of the massive black hole Sgr A* ? Recent results of Chandra confirmed that the most of X-ray flux (both continuum and Fe-K line emission) from the GC region is truly diffuse (Wang et al. 2002). On the other hand, surface brightness of the diffuse emission is found to be rather clumpy. The presence of the clumpy structures may favor the multiple-SNe scenario. In fact, new X-ray SNRs have been discovered by observations with Chandra (e.g. Maeda et al. 2002). In this paper, we investigate newly discovered clumpy structures near the GC to reveal the origin of the diffuse X-ray emission. Discovery of New SNR Candidates in the Galactic Center Region with ASCA and ChandraAtsushi Senda1, Hiroshi Murakami2, Aya Bamba1, Shin-ichiro Takagi1, and Katsuji Koyama11 Department of Physics, Kyoto University, Japan; 2 Institute of Space and Astronautical Science (ISAS),JapanE-mail: senda@cr.scphys.kyoto-u.ac.jp The origin of the diffuse X-ray emission from the Galactic Center (GC) region has been an open issue over decades. Ginga and ASCA found the large-scale (~1°x 1°) thin-thermal plasma with strong lines from ionized iron (Koyama et al. 1989; 1996, Yamauchi et al. 1990). The physical properties of the large scale hot plasmaare as below. ・ electron temperature kT ~ 10 keV ・ total thermal energy E ~ 1054 ergs ・ an age of the plasmat ~ 105 year 2. Observations and X-ray Images 0.2° l = 0.0° 359.8° 359.6° 0.2° l = 0.0° 359.8° 359.6° b = 0.0° b = 0.0° G359.77-0.09 0.7° 0.6° 0.5° 0.1° G359.92-0.09 G0.570-0.018 0.0° -0.2° -0.2° G359.79-0.26 -0.1° ACIS Sgr B2 region 6.0-7.0 keV Chandra ACIS Galactic Center 3.0-8.0 keV Chandra ACIS Galactic Center 1.0-3.0 keV 3. Individual diffuse sources G359.79-0.26 and G359.77-0.09 G0.570-0.018 G359.92-0.09 58’ Sgr A East G0.570-0.018 is discovered by ASCA (Sakano et al. 2002). Chandra observation resolved this source as extended, shell-like structure. Obtained X-ray spectrum is consistent with that obtained with ASCA, which exhibits extremely strong Fe-K line emission . The combined X-ray spectra are well reproduced by a thermal NEI model. Ho et al. (1985) reported that there is non-thermal radio shell located about 5’ south of the SNR Sgr A East, and named it G359.92-0.09 as a possible GC SNR candidate. Chandra observation reveals an X-ray excess fills an eastern half (EH) and southwest(SW) part of the radio shell G359.92-0.09. Northwest part shows no excess in the shell because of the contamination of the intense X-ray emission from Sgr A East. In the southwest edge of the shell, an X-ray bright filament are also discovered, which clearly corresponds with a non-thermal radio filament called “wisp”. X-ray spectra are extracted from three different region; Eastern half (EH), Southwest quadrant (SW), and wisp. An thermal NEI model yields an acceptable fit for a spectrum from each region. The narrow band image of the Chandra GC Survey shows that soft diffuse emissions extend from the Galactic Center to the galactic southeast direction. The extended emission is relatively soft and clumpy distributed. From these clumps, we focused on the two bright clumps and named G359.79-0.26 and G359.77-0.09. These clumps were also detected with ASCA and ROSAT. X-ray spectra of each clumps exhibit K-line emissions from He-like and H-like ions such as Si, S, Ar, and Ca. The results of the spectral fitting with thermal NEI model show that their physical parameters (NH and metal abundances) are similar to each other. In addition, the 1-3 keV band image shows G359.79-0.26 and G359.77-0.09 are south and north part of the large (~30 pc) elliptical shell, respectively. These indicate that the two clumps have the same origin, an energetic explosion such as a supernova occurred at the center of the large shell. -29°00’ Dec (1950) G359.92-0.09 02’ wisp 04’ ACIS 3.0-8.0 keV 40s 17h42m30s 20s R.A. (1950) Sgr A East G359.92-0.09 wisp VLA 6cm (Ho et al. 1985) G359.77-0.09 Best fit results of the thermal VNEI model Best fit results of the thermal NEI model G359.77-0.09 G359.79-0.26 kT 1.31 0.82 [keV] (1.03—1.79) (0.75—0.93) τ 0.5 64 [1011 s cm-3] (0.1—1.6) (5.6 <) NH 5.8 4.9 [1022 H cm-2] (5.1— 6.5) (4.6—5.2) Flux 2.2 2.3 [10-12 ergs s-1 cm-2] Abundances[solar] Si 0.6 (0.4—0.9) 0.4 (0.3—0.6) S 0.8 (0.5—2.1) 0.8 (0.5—1.0) Ar 0.3 (< 1.0) 1.3 (0.4—2.2) Ca 1.4 (< 3.3) 3.4 (1.4—5.6) χ2/d.o.f. 153.9/109 197.6/163 G0.570-0.018 kT[keV] 6.1 (3.1—26) τ [1010 s-1 cm-3] 1.7 (1.3—2.7) NH [1022 H cm-2] 13.9 (10.7—17.2) Abundance [solar] 4.5 (>1.6) Flux [ergs s-1 cm-2] 8.2 (7.7—8.7) χ2/d.o.f. 41.2/40 Best fit results of the thermal NEI model EH EH SW wisp kT11.4 2.6 12.5 [keV] (3.4<) (1.9 <) (7.1—80.0) τ 1.4 2.1 190 [1011 s cm-3] (0.8—5.4) (0.01 <) (0.001 <) NH6.0 18 35 [1022 H cm-2] (3.7—8.3) (7.0—33) (29—40) Flux 1.5 0.4 0.4 [10-12 ergs s-1 cm-2] χ2/d.o.f. 44.3/38 9.8/9 8.83/7 G359.79-0.26 SE By applying Sedov self-similar model R = 0.4 pc E = 3.5 x 1048 ergs kT = 6.1 keV na = 5.1 cm-3 E.M.= 8.1 x 1056 cm-3 t = 70 yrs Black : Chandra ACIS Green, Red : ASCA GIS 2, GIS3 Blue : ROSAT PSPC ・E. M. = 1.1 x 1057 cm-3 ・EEH = 1.6 x 1050 ergs ・ne = 0.4 cm-3 ・ t = 3800 yr (from the sound velocity@10keV) 1.2 x 10⁴ yr (from an ionization parameter) wisp ⇒The swept up mass (M= na x 4/3πR3 = 0.03Mo) and estimated initial energy are both extremely small compared with that of a usual SNR. ⇒ Only a tiny fraction of the explosion energy (~1051 ergs) and ejected mass (~ a few Mo) are converted to thermal plasma. G0.570-0.018 is a young SNR which is not in an adiabatic phase but still in a free expansion phase. (Senda et al. 2002, ApJ) By applying Sedov self-similar model R = 16.5 pc E = 2.1 x 1051 ergs kT = 0.8 keV na = 0.3 cm-3 E. M. = 1.47 x 1059 cm-3 t = 6900 yr t = 2.4x10⁴ yr (from an ionization parameter) Supposed two clumps are the part of a large shell-like structure, its energetics are consistent with that of a typical SNR. Young (3800—12000 yr) SNR 4. Discussion 5. Summary non-thermal sources • With Chandra data, we found diffuse emission from the GC region has clumpy structures. • Some of these clumps show thermal spectra from high temperature (~10keV) plasma (G0.570-0.018 and G359.92-0.09), some show that from lower temperature (~1keV) plasma (G359.77-0.09 and G359.79-0.26). • Their shell-like morphology and energetics suggest that they are SNRs. G359.92-0.09 has a counterpart of a non-thermal radio shell. • Total diffuse emission from the GC emission is grater than that of GC SNRs by 1—2 order of magnitude, hence a relation between the GC diffuse and SNRs is unclear yet. • Recently, a number of SXSs are found in the Galactic Plane, while no SXS has found yet in the GC region. The origin of the thermal diffuse emission for the GC region In the Galactic plane, a number of Synchrotron X-ray dominant SNRs (SXSs) have been found with ASCA (Bamba et al. 2001, 2002) and Chandra (Ueno et al. 2002). In the GC region, no SXSs have ever been found, however, deep observations with Chandra or Newton will be found SXSs in the GC region. ・GC plasma has at least two temperature thermal components kT ~ 10keVhard component ← G359.92-0.09,G0.570-0.018 kT ~ 1 keVsoft component ← G359.77-0.09 andG359.79-0.26 ・To explain the total luminosity of GC diffuse emission (~2 x 1038 ergs/s) with the sum of SNRs, ~100 SNRs should be detected in an X-ray band, which are far grater than the number of the present detection. ⇒Undetected SNRs ?Other origin ? (a) (b) (c) (d) AX J1841.0-0536 G28.6-0.1 G25.5+0.0 GC plasma G0.570-0.018 G359.79-0.26 G11.0+0.0 G11.2-0.3 + G26.6-0.1 = (a) Γ=1.6 (b) Γ=1.8 (c) Γ=1.3 (d) Γ=2.1 References Bamba, A. et al. 2001, PASJ, 53, L21 Bamba, A. et al. 2002, submitted to ApJ Coil, A. L, and Ho, P. T. P. 2000, ApJ, 533, 245 Koyama, K. et al. 1989, nature, 339, 603 Koyama, K. et al. 1996, PASJ, 48, 249 Ho, P. T. P. et al. 1985, ApJ, 288, 575 Maeda, Y. et al. 2002, ApJ, 570, 671 Murakami, H. 2002, Ph.D thesis, Kyoto Univ. Sakano, M. et al. 2002, ApJS, 138, 19 Senda, A et al. 2002, ApJ, 565, 1017 Ueno, M. et al. 2002, submitted to ApJ Wang, Q. D. et al. 2002, nature, 415, 148 Yamauchi, S. et al. 1990, ApJ, 1990, 365, 532 Images: ASCA GIS 0.7-10keV (coordinates are in Galactic) Spectra: GIS2+3 data fitted with power-law model