Download
1 / 1
10 likes | 99 Views
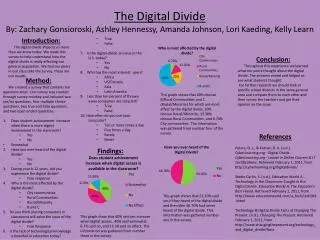
Explore the impact of the digital divide through survey results gathered from peers, providing insights and suggesting further research options in the education sector.

E N D
Introduction: The digital divide impacts us more than we know today. We made this survey to help understand how the digital divide is really affecting our general population. We had our peers in our class take the survey, these are our results. • True • False • 7. Is the digital divide an issue in the U.S. today? • Yes • No • 8. Who has the most internet users? • Africa • US/Canada • Asia • Latin America • 9. Less than ten percent of thrown away computers are recycled? • True • False • 10. How often do you use your computer? • Ten or more times a day • Five times a day • Rarely • Never • Findings: Conclusion: Throughout this experience we learned what our peers thought about the digital divide. The answers varied and helped us see what students thought. For further research we should look at specific school districts in the same general area and compare them to each other and then survey the teachers and get their opinion on the issue. The Digital DivideBy: Zachary Gonsioroski, Ashley Hennessy, Amanda Johnson, Lori Kaeding, Kelly Learn • Method: • We created a survey that contains ten questions total. Our survey was created through survey monkey and included two yes/no questions, four multiple choice questions, two true and false questions, and two open ended questions. • Does student achievement increase when there is more digital involvement in the classroom? • Yes • No • Somewhat • 2. Have you ever heard of the digital divide? • Yes • No • 3. During your k-12 years, did you experience the digital divide? • Free response • 4. Who is the most affected by the digital divide? • City communities • Rural Communities • Racial/Minority • B and C • 5. Do you think placing computers in classrooms will solve the issue of the digital divide? • Free Response • 6. Is the lack of technological knowledge a downfall in education today? This graph shows that 60% choose B(Rural Communities and C (Racial/Minority) for which are most affect by the digital divide. 20% choose Racial/Minority, 13.30% choose Rural Communities, and 6.70% City communities. The information was gathered from number four of the survey. References Peters, D. L., & Kuttan, D. A. (n.d.). CyberLearning.org - Digital Divide. CyberLearning.org - Leader in Online Courses & IT Certifications. Retrieved February 1, 2011, from http://cyberlearning.org/digitaldivide/ Steele-Carlin, S. (n.d.). Education World A : Technology in the Classroom: Caught in the Digital Divide. Education World A; The Educator's Best Friend. Retrieved February 1, 2011, from http://www.educationworld.com/a_tech/tech041.shtml Technology & Digital Divide Facts at Changing The Present. (n.d.). Changing The Present. Retrieved February 1, 2011, from http://www.changingthepresent.org/technology_and_digital_divide/facts This graph shows that 53.30% said yes if they heard of the digital divide and the other 46.70% had never heard of the digital divide. This information was gathered number one in the survey. This graph show that 40% said yes increase when digital access , 40% said somewhat, 6.7% said no, and 13.30 said no effect. The information was gathered from number three in the survey.