Statistical Classification for Gene Analysis based on Micro-array Data
Statistical Classification for Gene Analysis based on Micro-array Data. Fan Li & Yiming Yang hustlf@cs.cmu.edu In collaboration with Judith Klein-Seetharaman. Principles of cDNA microarray. DNA clones. Treated sample. Laser 2. Laser 1. Reference. Excitation. Reverse transcription.

Statistical Classification for Gene Analysis based on Micro-array Data
E N D
Presentation Transcript
Statistical Classification for Gene Analysis based on Micro-array Data Fan Li & Yiming Yang hustlf@cs.cmu.edu In collaboration with Judith Klein-Seetharaman
Principles of cDNA microarray DNA clones Treated sample Laser 2 Laser 1 Reference Excitation Reverse transcription PCR purification Label with Fluorescent dyes Emission Robot printing Hybridize target to microarray Computer analysis G. Gibson et al.
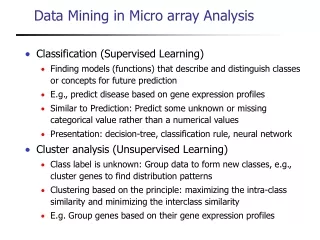
Microarray data : how it looks like ? G1 G2GN-1GN Exp 1 Exp 2 Exp 3 Expi Exp M Expression level of a gene across treatments Expression matrix Expression profiles of genes in a certain condition Typical examples Heat shock, G phase in cell cycle, etc … conditions Liver cancer patient, normal person, etc … samples
AML/ALL micro-array dataset • This dataset can be downloaded from http://genome-www.standford.edu/clustering • Maxtrix • Each Row – a gene • Each column – a patient (a sample) • Each patient belong to one of two diseases types: AML(acute myeloid leukemia) or ALL (acute lymph oblastic leukemia) disease • The 72 patient samples are further divided into a training set(including 27 ALLs and 11 AMLs) and a test set(including 20 ALLs and 14 AMLs). The whole dataset is over 7129 probes from 6817 human genes.
Published work on AML/ALL • Classification task: gene expression -> {AML, ALL} • Techniques: Support Vector Machings (SVM), Rocchio-style and logistic regression classifiers • Main findings: classifiers can get a better performance when using a small subset (8) of genes, instead of thousands • Implication: Many genes are irrelevant or redundant?
disease Gene1 Gene2 Gene3 Gene4 Gene5 Gene6 Gene7 Gene8 Possible Relationship (Hypothesis)
How can find such a structure? • Find the most informative genes (“primary” ones) • Statistical feature selection (brief) • Find the genes related (or “similar”) to the primary ones • Unsupervised clustering (detailed) • based on statistical patterns of gene distributed over microarrays • Bayes network for causal reasoning(future direction)
Gene1 Gene2 Gene3 Gene4 Gene5 Gene6 Gene7 Gene8 Possible Relationship (Hypothesis) disease
Feature selection • Feature selection • Choose a small subset of input variable (a few instead of 7000+ genes, for example) • In text categorization • Features = words in documents • Output variables = subject categories of a document • In protein classification • Features = amino acid motifs … • Output variables = protein categories • In genome micro-array data • Features = “useful” genes • Output variables = diseased or not of a patient
Feature selection on micro-array (ALM vs ALL) • Golub-Slonim: GS-ranking (filtering method) • Ben-Dor TNoM-ranking (filtering method) • Isabelle-Guyon: Recursive SVM(Wrapper method) • Selected 8 genes (out of 1000+ in that dataset) • Accuracy 100% • Our work (Fan & Yiming) (best) • Selected 3 genes (using Ridge regression) • Accuracy 100%
Feature selection experiments already done in this micro-array data • The 3 genes we found • Id1882: CST3 Cystatin C(amyloid angiopathy and cerebral hemorrhage) M27891_at • Id6201: INTERLEUKIN-8PRECURSOR Y00787_at • Id4211: VIL2 Villin 2(ezrin) X51521_at
Some analysis on the result we get • The first two genes are strongly correlated with each other. • The third gene is very different from the first two genes. • 1st gene + 2nd gene is bad (10/34 errors) • 1st gene + 3rd gene is good (1/34 error)
Question:As the next step, Can we find more gene-gene relationship? Several techniques available: • Clustering • Bayesian network learning • Independent component analysis • …
Clustering Analysis in micro-array data • Clustering methods have already been widely used to find similar genes or common binding sites from micro-array data. • A lot of different clustering algorithms… • Hierarchical clustering • K-means • SOM • CAST • ……
A example of hierarchical clustering analysis(from Spellman et al.)
Our clustering experiment on AML/ALL dataset • Our clustering result is over the top 1000 genes most relevant to the disease.
Some analysis to the clustering result • The first two genes are always clustered in the same cluster(in hierarchical clustering, they are in cluster 1. In k-means clustering, they are in cluster 2) • The third gene is always not clustered in the same group with the first two genes(in hierarchical clustering, it is in cluster 23. In k-means clustering, it is in cluster 1) • This validates our previous analysis.
Disadvantage of Clustering • However… • It can not find out the internal relationship inside one cluster • It can not find the relationship between clusters • genes connected to each other may not be in the same cluster. • Clustering vs Bayesian network learning(copied from David K,Gifford, Science, VOL293, Sept,2001)
Bayesian network learning • Thus Bayesian network seems a much better technique if we want to model the relationship among genes. • Researcher have done experiments and constructed bayesian networks from micro-array data. • They found there are a few genes which have a lot of connections with other genes. • They use prior biology knowledge to validate their learned edges(interactions between genes and found they are reasonable)
A example of the bayesian network • Part of the bayesian network Nir Friedman constructed. There are total 800 genes(nodes) in the graph. These 800 genes are all cell-cycle regulated genes.
Our plan in genetic regulatory network construction There are several possible ways • Using feature selection technique to make the network learning task more robust and with less computational cost. • Learning gene regulatory networks on microarray dataset with disease labels(thus we may find pathways relevant to specific disease). • Using ICA to finding hidden variables(hidden layers) and check its consistency with bayes network learning result.
Our plan in genetic regulatory network construction • Use prior prior biology knowledge in gene network ,like the “network motifs”.The following example is copied from Shai S.Shen-Orr, Naturtics ,genetics, 2002.Previous network learning algorithm have not considered those characters.
Reference • Using Bayesnetwork to analyze Expression Data , Nir Friedman, M.Linial, I.Nachman, Journal of Computational Biology , 7:601-620, 2000. • Gene selection for cancer classification using support vector machines. Guyon,I.et al. Machine Learning,46,389-422. • Clustering analysis and display of genome-wide expression patterns, Eisen,M.B. et al. PNAs, 95:14863-14868, 1998 • Clustering gene expression patterns . Ben-Dor, A.,Shamir,R., and Yakini,Z., Computational Biology, 6(3/4):281-297, 1999.