
Abstract
Validation of Automated Snow Maps. Multisensor Automated Snow and Ice Mapping System. Comparison with NOAA interactive snow charts over Northern Hemisphere. Objective : Provide global daily continuous snow cover maps at high, 4 km, spatial resolution for use in NWP models.

Abstract
E N D
Presentation Transcript
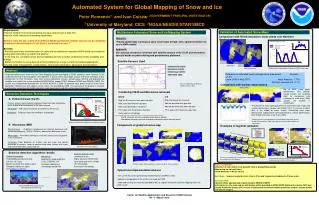
Validation of Automated Snow Maps Multisensor Automated Snow and Ice Mapping System Comparison with NOAA interactive snow charts over Northern Hemisphere Objective: Provide global daily continuous snow cover maps at high, 4 km, spatial resolution for use in NWP models EURASIA SNOW EXTENT Automated snow map NOAA IMS (Interactive) Approach: Use synergy of snow/ice retrievals with satellite sensors in the vis/IR and microwave spectral bands on polar orbiting and geostationary platforms. Satellite Sensors Used Automated Abstract IMS (Interactive) Snow extent: Automated vs Interactive (IMS) snow maps Automated Multisensor Snow and Ice Cover Mapping System developed at STAR combines snow retrievals in the visible/infrared and in the microwave. The algorithm is built to utilize advantages of each of the two technique and to compensate for their limitations. Data from several operational sensors onboard polar orbiting and geostationary satellites are used in the system including AVHRR NOAA, Imager GOES, Meteosat SEVIRI and SSMI(S) DMSP. The system was implemented operationally at NOAA NESDIS in 2006 to generate daily global maps of snow cover distribution. Maintenance and updates to the system are provided by STAR. The accuracy of the product is routinely monitored by comparing with NOAA interactive snow cover charts and with surface observation data. Difference in estimated yearly average snow area extent: Eurasia: +1.0% (June 2006 to May 2007) North America: -1.70% Northern Hemisphere: -0.1% Areas of application of different satellite sensors data Comparison with surface observations Combining VIS/IR and Microwave retrievals Up to 3000 snow depth observations from ground-based stations are available daily for comparison and validation of snow maps. Most stations are located in midlatitudes. Snow/Ice Detection Techniques ICE Map microwave ice retrievals Add ice identified with geo data Add ice identified with polar-orb data Fill in gaps with the previous day data SNOW Map Vis/IR retrievals from polar-orb.data Add snow identified with geo data Add snow identified in microwave Fill in gaps with the previous day data Verify against climatology A. Visible/Infrared (Vis/IR) Primary feature used to detect snow/ice: Drop from high reflectance in the visible to low reflectance in the near-infrared. The percent of exact correspondence of automated snow maps and surface observations ranges from almost 100% in summer to about 80% in the middle of winter season. Automated snow maps demonstrate slightly better correspondence to surface observations than NOAA interactive snow charts (IMS). Advantage: High spatial resolution of satellite vis/IR sensors Limitations: Requires clear-sky conditions and daylight Vis/IR retrievals are not available when dark or cloudy Microwave retrievals are not used over mountains and in coastal areas Components of global snow/ice map Percent of exact correspondence of automated snow maps (green) and NOAA interactive snow maps (blue) to surface observations of snow cover Spectral reflectance of different surface cover types B. Microwave (MW) Examples of regional validation Physical basis: Brightness temperature of snow/ice decreases with increasing frequency (10GHz-100GHz), polarization difference is low. Advantages: All-weather technique since most clouds are transparent in the microwave Limitations: Poor detection of shallow and wet snow, low spatial resolution of sensors, tends to confuse cold rocky surface with snow and mixed land/water surface with ice Ice cover: automated algorithm Microwave emissivity spectra Automated IMS (interactive) Nov 10 Nov 15 Nov 20 Snow/ice detection algorithms: details Nov 25 Auxiliary datasets used: Land/water mask Digital elevation (GTOPO30) Land cover type (Univ. of Md) LST climatology Snow cover climatology Nov 30 Dec 5 Visible/infrared data: Threshold-based, decision-tree 0.6, 0.9, 1.6, 11µm Spatial variability filter (polar & geo) Temporal stability test (geo) Climatology-based filter Primary output: daily continuous snow/ice map at 4 km resolution. Microwave: Modified N. Grody algorithm 19,22,37,85GHz, V,H Temporal stability test Climatology-based filter Dec 10 Dec 15 Ice cover: Interactive product Operational implementation and use Freeze-up of Hudson bay as mapped in the Automated and in Interactive (IMS) product Distribution of snow and estimated snow extent from Automated and Interactive (IMS) product. The system has been operationally implemented at OSDPD in 2006 Updates and upgrades of the system are made by STAR Snow and ice map are routinely provided to NIC to support interactive snow/ice mapping within the IMS system NOAA/AVHRR RGB composite and corresponding snow/ice map Automated System for Global Mapping of Snow and Ice Peter Romanov1 and Ivan Csiszar 2(GOVERNMENT PRINCIPAL INVESTIGATOR) 1University of Maryland, CICS 2NOAA/NESDIS/STAR/SMCD Requirements: • Improve weather forecast and warning accuracy and amount of lead time • Improve water resources forecasting capabilities Science: How the use of data from different NOAA operational satellite sensors can be optimized to improve characterization of the Earth’s snow and ice cover ? Benefits: • Accurate and timely characterization of snow and ice distribution improves NOAA ability to provide the society with information on water and weather • In the long run, consistent snow and ice datasets will help to better understand climate variability and change • Better information on snow and ice will be beneficial for a large number of practical applications including water management, transportation, hydropower generation, agriculture and recreation. Science Challenges: • Detection of fresh-fallen snow beneath thick or precipitating clouds • Monitoring ice on small lakes • Snow detection in dense forests Next Steps:Improve resolution from 4 km to 2 km and frequency of updates to 2 times a day Transition Path: • System will be operationally implemented at NESDIS OSDPD. • Information on the snow and ice distribution will be provided to NOAA NCEP, National Ice Center (NIC) and Climate Prediction Center (CPC) for use in operational numerical weather prediction models, climate models and climate analysis.


