Download
1 / 35
350 likes | 471 Views
Analysis of Hazardous Fog and Low Clouds Using Meteorological Satellite Data. Gary P. Ellrod NOAA/NESDIS, Camp Springs, MD (Gary.Ellrod@noaa.gov). Outline. Benefits/limitations of remote sensing Detection of low clouds Night: Longwave – Shortwave IR Day: Visible and Shortwave IR

E N D
Analysis of Hazardous Fog and Low Clouds Using Meteorological Satellite Data Gary P. Ellrod NOAA/NESDIS, Camp Springs, MD (Gary.Ellrod@noaa.gov) FRAM, Montreal, Que 15 June 2005
Outline • Benefits/limitations of remote sensing • Detection of low clouds • Night: Longwave – Shortwave IR • Day: Visible and Shortwave IR • Determination of low ceilings • Fog depth estimates • Technology upgrades needed • Summary FRAM, Montreal, Que 15 June 2005
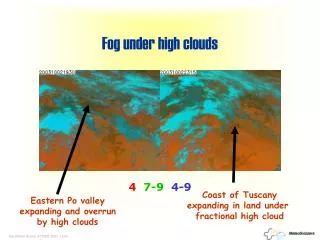
Nighttime GOES Infrared Fog Detection Capabilities • Advantages: • High frequency (15-30 min) • Good spatial coverage, resolution (4km) • Limitations • Obscuration by higher clouds • Some fog too narrow, thin to detect • False signatures (sandy soils) • Is it fog or stratus? FRAM, Montreal, Que 15 June 2005
Nighttime fog product from GOES Sounder, June 1987 Remote Sensing of Fog • Radiative studies (Hunt 1973) • Experience with AVHRR in U.K. (Eyre et al 1984) • GOES investigations • Gurka 1978, 1980 • Ellrod 1991, 1994 • Lee (NRL) et al 1997 • METEOSAT • Cermak, Bendix FRAM, Montreal, Que 15 June 2005
Radiative Properties of Clouds FRAM, Montreal, Que 15 June 2005
Nighttime Fog Detection Using GOES Multi-spectral Image Data FRAM, Montreal, Que 15 June 2005
Features Observed in Nighttime Fog Images Yellow = T4 – T2 > 2C FRAM, Montreal, Que 15 June 2005
Fog-related Highway AccidentWindsor, Ont., 3 Sep 1999 (Pagowski et al 2004) FRAM, Montreal, Que 15 June 2005
Spread of Lake Fog – Time Lapse FRAM, Montreal, Que 15 June 2005
Daytime Fog Detection • Visible images • Smooth texture, sharply defined borders, moderate brightness • 3.9 mm IR (or 1.6mm AVHRR) • Fog droplets are good reflectors at 3.9mm • Result is relatively warm Tb • Snow is poor reflector at 3.9mm • Result: Good contrast with snow or cold ground FRAM, Montreal, Que 15 June 2005
Fog Clearing on 3 Sep 1999 FRAM, Montreal, Que 15 June 2005
Snow vs Fog Using Visible and Shortwave IR MODIS Visible CH1 MODIS 1.6mm CH6 FRAM, Montreal, Que 15 June 2005
Snow vs Fog Using Visible and Shortwave IR MODIS Visible CH1 MODIS 3.9mm CH6 FRAM, Montreal, Que 15 June 2005
RGB Depiction of Fog Over Snow-Covered Ground (MODIS) Red = Visible Green= 1.6mm Blue= 11mm IR Fog is yellow Snow is red Bare surface is green FRAM, Montreal, Que 15 June 2005
Daytime Fog DiscriminationUsing Visible and IR Data FRAM, Montreal, Que 15 June 2005
Ellrod 2003 Brown 1987 Estimation of Low Cloud Base Category from GOES • When GOES IR cloud top is <4º K from surface temperature, low clouds (<1000 ft) likely FRAM, Montreal, Que 15 June 2005
Low Visibility Determination FRAM, Montreal, Que 15 June 2005
GOES Low Cloud Base Product Available for all regions of the U. S. and parts of southern Canada at:http://www.orbit.nesdis.noaa.gov/smcd/opdb/fog.html FRAM, Montreal, Que 15 June 2005
Regional Statistics *Completed in 2001-2002 Verification of LCB Product * Overall verification for low clouds detected but not covered by cirrus clouds (N = 2381): • POD = 72 % • FAR = 11 %
San Francisco Fog Project (Terabeam Inc, 2001)GOES Ceiling Categories Categories created to compare satellite data with ceilometer data. FRAM, Montreal, Que 15 June 2005
San Francisco Fog Project (Terabeam) Brightness values plotted against ceilometer ceiling heights. Top-left and bottom-right quadrants (separated by dashed lines) show category 1 and 2 agreement, respectively. Top-right shows false alarms, bottom-left shows under-detection.
Estimation of Fog Depth • Based on BTD for 3.9mm and 10.7mm IR • Developed using cloud top heights from aircraft pilot reports (PIREPs) Brightness count difference (GOES-7 Sounder) vs fog depth estimated from PIREPs FRAM, Montreal, Que 15 June 2005
Fog Depth Verification FRAM, Montreal, Que 15 June 2005
Fog Depth Product – 3 Sep 99 FRAM, Montreal, Que 15 June 2005
Fog Depth Estimation • Application of fog depth to forecast burnoff time GOES Fog Depth, 1045 UTC FRAM, Montreal, Que 15 June 2005
GOES visible, 1415 UTC GOES Fog Depth, 1045 UTC Results for 3 Sep 99 Case FRAM, Montreal, Que 15 June 2005
Visible Brightness DifferencesFog vs Cloud-Free to Estimate Clearing Time • Requires visible (CH1) imagery >1.5 hours after sunrise (Gurka 1974) • Uses following data: • Digital brightness count difference (fog vs clear region) • Obtain incoming solar radiation • Larger brightness difference = longer clearing time after sunrise FRAM, Montreal, Que 15 June 2005
Depth Threshold for GOES Detection 270 m ~160 m ~100 m ? FRAM, Montreal, Que 15 June 2005
Technology Upgrades Needed for Better Fog Detection from GOES FRAM, Montreal, Que 15 June 2005
1. Optimal SWIR wavelengths FRAM, Montreal, Que 15 June 2005
2. Improved ResolutionBased on AVHRR IR (3.7 mm and 11.0 mm) FRAM, Montreal, Que 15 June 2005
3. Improved Signal to Noise MODIS Fog Depth GOES Fog Depth FRAM, Montreal, Que 15 June 2005
Summary and Conclusions • GOES can effectively detect fog/low clouds and show areal extent • Problems with small scale, shallow fog • Able to estimate fog depth, ceilings • Good correlation with SFO visibility data • GOES needs to be complemented by surface data to be most effective • GOES-R will have major upgrades http://www.orbit.nesdis.noaa.gov/smcd/opdb/fog.html FRAM, Montreal, Que 15 June 2005
References • Hunt, G. E., 1973: Radiative properties of terrestrial clouds at visible and IR thermal window wavelengths. QJRMS, 99, 346-369. • Eyre, J. R., J. L. Brownscombe, and R. J. Allam, 1984: Detection of fog at night using AVHRR imagery. Meteor. Mag., 113, 266-271. • Ellrod, G. P., 1994: Advances in the detectio of fog at night using GOES multispectral IR imagery, Wea. Forecasting, 10, 606-619. • Pagowski, M., I. Gultepe, and P. King, 2004: Analysis and modeling of an extremely dense fog event in Southern Ontario. J. Appl. Meteor., 43, 3-16. FRAM, Montreal, Que 15 June 2005
References • Brown, R., 1987: Observations of the structure of a deep fog. Meteorological Magazine, 116, 329-338. • Ellrod, G. P., 2002: Estimation of low cloud base heights at night from satellite infrared and surface temperature data. Nat. Wea. Digest, 26, 39-44. • Fischer, K. et al, 2003: Validation of GOES Imager experimental low cloud data products for terrestrial free space optical telecommunications. 12th AMS Conference on Satellite Meteor. and Oceanography, Long Beach, California, 9-13 Feb 2003. • Gurka, J., 1974: Using satellite data for forecasting fog and stratus dissipation. Preprints, 5th Conf. on Weather Forecasting and Analysis, March 4-7, 1974, St. Louis, MO, AMS, Boston, 54-57. FRAM, Montreal, Que 15 June 2005