html5-img
1 / 10

How Are We Doing? 2010-11 Washington Graduation Statistics

How Are We Doing? 2010-11 Washington Graduation Statistics . Deb Came GATE Advisory Meeting June 5, 2012. Graduation Rates. Different Methodologies. Traditional Method. Cohort (new) Method. Comparison of Methods. Grad Rates by Ethnicity / Race Four-Year Adjusted Cohort Method.

limei
Download Presentation

How Are We Doing? 2010-11 Washington Graduation Statistics

An Image/Link below is provided (as is) to download presentation Download Policy: Content on the Website is provided to you AS IS for your information and personal use and may not be sold / licensed / shared on other websites without getting consent from its author. Content is provided to you AS IS for your information and personal use only. Download presentation by click this link. While downloading, if for some reason you are not able to download a presentation, the publisher may have deleted the file from their server. During download, if you can't get a presentation, the file might be deleted by the publisher.

E N D

Presentation Transcript


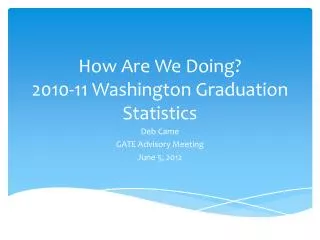
  1. How Are We Doing? 2010-11 Washington Graduation Statistics Deb Came GATE Advisory Meeting June 5, 2012

  2. Graduation Rates

  3. Different Methodologies Traditional Method Cohort (new) Method

  4. Comparison of Methods

  5. Grad Rates by Ethnicity / RaceFour-Year Adjusted Cohort Method

  6. Grad Rates by SubgroupFour-Year Adjusted Cohort Method

  7. Districts with Lowest Grad Rate

  8. Districts with Highest Grad Rate

  9. Contact Deb Came, Ph.D. Director, Student Information, OSPI deb.came@k12.wa.us (360) 725-6356 Lisa Ireland Research Analyst, Student Information, OSPI lisa.ireland@k12.wa.us (360) 725-6358

More Related