Download
1 / 11
110 likes | 237 Views
This document outlines the calibration steps taken in the development of the NCTC Traffic Model for the year 2002. It integrates various data sources, including aerial photos and GIS maps, assessor's parcel data, and traffic analysis zones. Key components include the analysis of trip generation rates for different land uses such as single-family homes, multi-family units, commercial spaces, and schools. The model's accuracy is validated against existing traffic counts and census surveys, ensuring compliance with CALTRANS guidelines for forecasting and design process applications, including the Dorsey Interchange.

E N D
NCTC Traffic Model Update Year 2002 Calibration
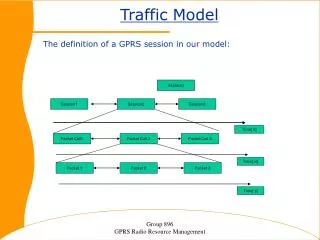
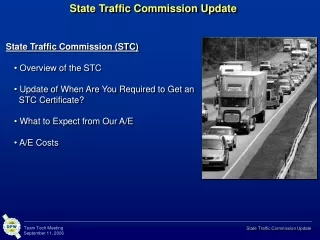
Steps in Model Development • Aerial Photos from GIS • Maps of Streets from GIS • Assessor’s Parcel Data • Traffic Analysis Zones • Trip Generation Rates • Productions and Attractions • Trip Assignment • Comparison to Existing Counts
Trip Generation Rates Trip Rate for Single Family = 0.9 pm trips/DU Trip Rate for Multi Family = 0.6 pm trip/DU Trip Rate for Church = 6.6 pm trips/acre Trip Rate for Commercial = 37.0 pm trips/acre Trip Rate for Elem School = 3.4 pm trips/acre Trip Rate for Fast Food = 291.3 pm trips/acre ETC
Validation of Year 2002 Model • Do counts and model match? • Is Trip Generation reasonable? • Is Trip Assignment compatible with Census Surveys for home to work? • Meets CALTRANS’ Guidelines
CALTRANS to Utilize NCTC Model • Forecast for Dorsey Interchange • Use in Design Process